1. Getting Started with Ergodic Insurance Framework
Welcome to the Ergodic Insurance Framework! This tutorial will help you get up and running with your first insurance optimization analysis in just a few minutes.
1.1. What You’ll Learn
By the end of this tutorial, you will:
Install the framework and verify your setup
Run your first manufacturer simulation
Understand the basic output metrics
Visualize wealth trajectories over time
Learn where to go next
1.2. Prerequisites
Python 3.12 or higher installed
Basic familiarity with Python (ability to run scripts)
No advanced mathematics or insurance knowledge required!
1.3. Installation
1.3.1. Step 1: Clone or Download the Framework
If you have git installed:
git clone https://github.com/AlexFiliakov/Ergodic-Insurance-Limits.git
cd Ergodic-Insurance-Limits
Or download the ZIP file from GitHub and extract it.
1.3.2. Step 2: Install Dependencies
We recommend using uv for faster installation:
pip install uv
uv sync
Alternatively, use standard pip:
cd ergodic_insurance
pip install -e .
1.3.3. Step 3: Verify Installation
Let’s verify everything is working:
# test_installation.py
from ergodic_insurance.manufacturer import WidgetManufacturer
from ergodic_insurance.claim_generator import ClaimGenerator
from ergodic_insurance.config_v2 import ManufacturerConfig

print("✅ Framework imported successfully!")

# Create configuration
config = ManufacturerConfig(
    initial_assets=10_000_000,
    asset_turnover_ratio=1.0,
    base_operating_margin=0.08,
    tax_rate=0.25,
    retention_ratio=0.7
)

# Create a simple manufacturer
company = WidgetManufacturer(config)

print(f"✅ Created company with ${company.assets:,.0f} in assets")
print("🎉 Installation successful!")
1.4. Your First Simulation
Now let’s run a real simulation to see how insurance affects your company’s growth trajectory.
1.4.1. Step 1: Create the Basic Setup
# first_simulation.py
import numpy as np
import matplotlib.pyplot as plt
from ergodic_insurance.manufacturer import WidgetManufacturer
from ergodic_insurance.claim_generator import ClaimGenerator
from ergodic_insurance.config_v2 import ManufacturerConfig

# Set random seed for reproducibility
np.random.seed(42)

# Configure the manufacturer
config = ManufacturerConfig(
    initial_assets=10_000_000,    # Starting with $10M
    asset_turnover_ratio=1.0,     # Generate revenue equal to assets
    base_operating_margin=0.12,        # Profit margin before losses (~8% margin after losses)
    tax_rate=0.25,                # 25% corporate tax
    retention_ratio=0.7           # Retain 70% of earnings
)

# Create a $10M widget manufacturer
manufacturer = WidgetManufacturer(config)

print(f"Company Profile:")
print(f"  Initial Assets: ${manufacturer.assets:,.0f}")
print(f"  Expected Annual Revenue: ${manufacturer.assets * config.asset_turnover_ratio:,.0f}")
print(f"  Expected Operating Income (Before Losses): ${manufacturer.assets * config.asset_turnover_ratio * config.base_operating_margin:,.0f}")
1.4.1.1. Expected Output:
Company Profile:
  Initial Assets: $10,000,000
  Expected Annual Revenue: $10,000,000
  Expected Operating Income (Before Losses): $1,200,000
1.4.3. Step 3: Run the Simulation
bankruptcy_no_ins_scenarios = []
bankruptcy_with_ins_scenarios = []

scenarios_no_insurance = []
scenarios_with_insurance = []

for scen in range(scenarios):
    ### Configuration 1: No insurance #######
    all_scenario_claims_no_ins = []
    manufacturer_no_ins = WidgetManufacturer(config)
    wealth_no_insurance = [config.initial_assets]

    for year in range(years):
        revenue = manufacturer_no_ins.calculate_revenue()  # Current revenue
        revenue_scale = revenue / config.initial_assets

        # Regular losses: 4-6 per year on average, typically $50K-$150K
        regular_frequency = regular_freq_baseline * revenue_scale  # Scale with revenue
        regular_generator = ClaimGenerator(
            base_frequency=regular_frequency,
            severity_mean=regular_sev_mean,
            severity_std=regular_sev_std,
        )

        # Catastrophic losses: ~0.1 per year (once every 10 years), but can be $1M-$5M
        catastrophic_frequency = cat_freq_baseline * revenue_scale  # Also scales with revenue
        catastrophic_generator = ClaimGenerator(
            base_frequency=catastrophic_frequency,
            severity_mean=cat_sev_mean,
            severity_std=cat_sev_std,
        )

        # Generate regular losses for this year
        regular_claims, _ = regular_generator.generate_enhanced_claims(
            years=1,
            revenue=revenue,
            use_enhanced_distributions=False,
        )

        # Generate catastrophic losses for this year
        catastrophic_claims, _ = catastrophic_generator.generate_enhanced_claims(
            years=1,
            revenue=revenue,
            use_enhanced_distributions=False
        )

        # Combine all losses for this year
        year_claims = regular_claims + catastrophic_claims

        # For no insurance, company pays all losses over time without collateral
        for claim in year_claims:
            manufacturer_no_ins.process_uninsured_claim(claim.amount)

        manufacturer_no_ins.step()
        wealth_no_insurance.append(manufacturer_no_ins.assets)

    if manufacturer_no_ins.is_ruined:
        bankruptcy_no_ins_scenarios.append(scen)

    scenarios_no_insurance.append(wealth_no_insurance)

    ### Configuration 2: With insurance ($100K deductible, $200M limit) #######
    manufacturer_with_ins = WidgetManufacturer(config)
    wealth_with_insurance = [config.initial_assets]

    for year in range(years):
        revenue = manufacturer_with_ins.calculate_revenue()  # Current revenue
        revenue_scale = revenue / config.initial_assets

        # Regular losses: 4-6 per year on average, typically $50K-$150K
        regular_frequency = regular_freq_baseline * revenue_scale  # Scale with revenue
        regular_generator = ClaimGenerator(
            base_frequency=regular_frequency,
            severity_mean=regular_sev_mean,       # Mean claim size $80K
            severity_std=regular_sev_std,        # Moderate variation
        )

        # Catastrophic losses: ~0.1 per year (once every 10 years), but can be $1M-$5M
        catastrophic_frequency = cat_freq_baseline * revenue_scale  # Also scales with revenue
        catastrophic_generator = ClaimGenerator(
            base_frequency=catastrophic_frequency,
            severity_mean=cat_sev_mean,    # Mean catastrophic loss $2M
            severity_std=cat_sev_std,     # High variation - can reach $5M+
        )

        # Generate regular losses for this year
        regular_claims, _ = regular_generator.generate_enhanced_claims(
            years=1,
            revenue=revenue,
            use_enhanced_distributions=False,
        )

        # Generate catastrophic losses for this year
        catastrophic_claims, _ = catastrophic_generator.generate_enhanced_claims(
            years=1,
            revenue=revenue,
            use_enhanced_distributions=False
        )

        # Combine all losses for this year
        year_claims = regular_claims + catastrophic_claims

        # Process each claim through insurance
        for claim in year_claims:
            company_payment, insurance_payment = manufacturer_with_ins.process_insurance_claim(
                claim_amount=claim.amount,
                deductible_amount=100_000,
                insurance_limit=200_000_000
            )

        # Pay annual premium based on current revenue scale
        current_revenue = manufacturer_with_ins.calculate_revenue()
        revenue_scale = current_revenue / config.initial_assets
        annual_premium = annual_premium_baseline * revenue_scale
        manufacturer_with_ins.record_insurance_premium(annual_premium)

        manufacturer_with_ins.step()
        wealth_with_insurance.append(manufacturer_with_ins.assets)

    if manufacturer_with_ins.is_ruined:
        bankruptcy_with_ins_scenarios.append(scen)

    scenarios_with_insurance.append(wealth_with_insurance)

print(f"Bankruptcies (no insurance): {len(bankruptcy_no_ins_scenarios)}/{scenarios}")
print(f"Bankruptcies (with insurance): {len(bankruptcy_with_ins_scenarios)}/{scenarios}")
1.4.3.1. Sample Output:
<Several Insolvencies>
Bankruptcies (no insurance): 35/100
Bankruptcies (with insurance): 0/100
1.4.4. Step 4: Visualize the Results
# Create comprehensive visualization
fig = plt.figure(figsize=(15, 6))

### Plot 1: Wealth trajectories comparison #######
ax1 = plt.subplot()

bankrupt_no_ins = []
bankrupt_with_ins = []

# Plot all scenarios
for idx, s in enumerate(scenarios_no_insurance):
    if idx in bankruptcy_no_ins_scenarios:
        ax1.plot(range(len(s)), s, color='red', alpha=0.1)
        bankrupt_no_ins.append(s)
    else:
        ax1.plot(range(len(s)), s, color='orange', alpha=0.1)
for idx, s in enumerate(scenarios_with_insurance):
    if idx in bankruptcy_with_ins_scenarios:
        bankrupt_with_ins.append(s)
    ax1.plot(range(len(s)), s, color='blue', alpha=0.05)

# Compute and overlay means
no_ins_mean = np.average(np.array(scenarios_no_insurance, dtype=float), axis=0)
with_ins_mean = np.average(np.array(scenarios_with_insurance, dtype=float), axis=0)

ax1.plot(range(len(with_ins_mean)), with_ins_mean, color='blue', linewidth=2, alpha=0.8, label='With Insurance (mean)')
ax1.plot(range(len(no_ins_mean)), no_ins_mean, color='orange', linewidth=2, alpha=0.8, label='No Insurance (mean)')
ax1.axhline(y=100_000, color='r', linestyle='--', alpha=0.5, label='Bankruptcy')
ax1.axhline(y=config.initial_assets, color='gray', linestyle=':', alpha=0.5)

ax1.set_xlabel('Year')
ax1.set_ylabel('Wealth ($)')
ax1.set_title('Wealth Trajectories: Insurance vs No Insurance')
ax1.set_ylim(0, 20_000_000)
ax1.legend()
ax1.grid(True, alpha=0.15)

plt.tight_layout()
plt.show()
1.4.4.1. Sample Output:
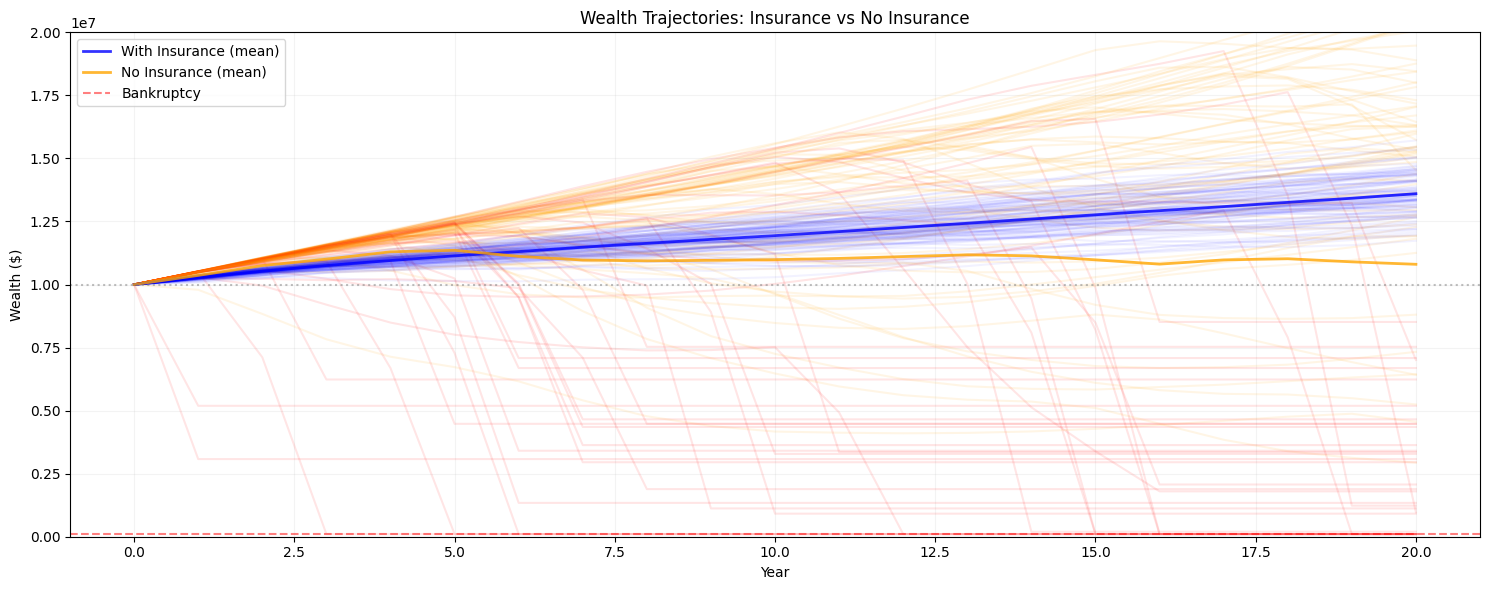
1.5. Understanding the Results
1.5.1. Why Insurance Creates Value
This demonstration shows the true value of insurance: protection against catastrophic losses that can bankrupt the company.
1.5.1.1. The Loss Structure
Regular Losses (~2 per year, $50K$150K each)
These are manageable without insurance
Total ~$160K per year on average
Catastrophic Losses (~0.1 per year, $1M-$5M each)
Occur roughly once every 10 years
Can exceed annual profits by 2-5x
These are what make insurance valuable
What’s not shown in this scenario is that catastrophic attritional losses (retaining too much below the deductible) can also matter, as can extremely large losses above the limit.
1.5.1.2. Key Insights
Not Buying Insurance Outperforms Insurance At First:
Ensemble Average dominates early on
As catastrophic losses get averaged into scenarios over time, the value of insurance emerges
The Catastrophic Protection:
Without insurance: A single loss can wipe out years of profits
With insurance: Maximum exposure is the deductible ($100K) per event
Long-term Growth Impact:
Insurance smooths the growth trajectory
Prevents bankruptcy during catastrophic years
Enables compound growth over time
1.5.2. What to Look For in the Graph
Wealth Trajectories (Top Left):
Light Red lines designate scenarios without insurance that go bankrupt
Notice that many of these outperform insurance early on
Light Red and Orange lines with steep drops designate catastrophic events
Notice how “No Insurance” drops sharply at these points
“With Insurance” shows smoother, more consistent growth
1.6. Common Patterns You’ll See in Future Simulations
The Insurance Paradox: Sometimes paying 2-3x expected losses in premiums is optimal!
Volatility Reduction: Insurance smooths the wealth trajectory
Growth vs. Safety Trade-off: Lower retention = safer but more expensive
Long-term Benefits: Insurance benefits compound over time
1.7. Next Steps
Now that you’ve run your first simulation, explore these topics:
Basic Simulation: Deep dive into the simulation mechanics
Configuring Insurance: Understanding layers, retentions, and limits
Optimization Workflow: Finding the optimal insurance strategy
Analyzing Results: Advanced metrics and decision-making
1.8. Quick Tips
Start Simple: Begin with single-layer insurance before exploring complex programs
Use Seeds: Set
np.random.seed()for reproducible results during testingExperiment: Try different retention levels to see the trade-offs
Think Long-term: Run simulations for 20-50 years to see ergodic effects
1.9. Getting Help
Check the Troubleshooting Guide for common issues
Review the FAQ for conceptual questions
Explore the API Documentation for detailed function references
Open an issue on GitHub
Contact: Alex Filiakov
1.10. Summary
Congratulations! You’ve successfully:
✅ Installed the Ergodic Insurance Framework
✅ Created your first manufacturer model
✅ Generated realistic loss scenarios
✅ Run simulations with and without insurance
✅ Visualized and interpreted the results
You’re now ready to explore more advanced features and optimize your insurance strategy!