Architectural Diagrams
This section provides comprehensive architectural visualizations of the Ergodic Insurance Limits system using interactive Mermaid diagrams. These diagrams illustrate the system’s structure, module relationships, data flows, and design patterns.
Note
The diagrams are interactive - you can zoom, pan, and click on elements for better viewing. If diagrams don’t render properly, try refreshing the page or viewing in a modern browser.
Understanding the Notation
Boxes: Represent classes, modules, or components
Arrows: Show dependencies, data flow, or relationships
Colors: Group related components (consistent across diagrams)
Labels: Describe the nature of relationships
Overview
The architecture documentation is organized into three main categories:
System-Level Views - High-level architecture and module relationships
Class Diagrams - Detailed class structures and interactions
Data Flow Patterns - How information moves through the system
High-Level System Context
The system context diagram shows the overall architecture, including all major components, external systems, and data flows. The system is organized into 9 major subsystems with over 50 modules.
High-Level System Context Diagram
Executive Summary
The Ergodic Insurance Limits framework analyzes insurance decisions using time-average (ergodic) theory rather than traditional ensemble averages. This approach reveals that insurance can enhance business growth even when premiums exceed expected losses by 200-500%, transforming insurance from a cost center to a growth enabler.
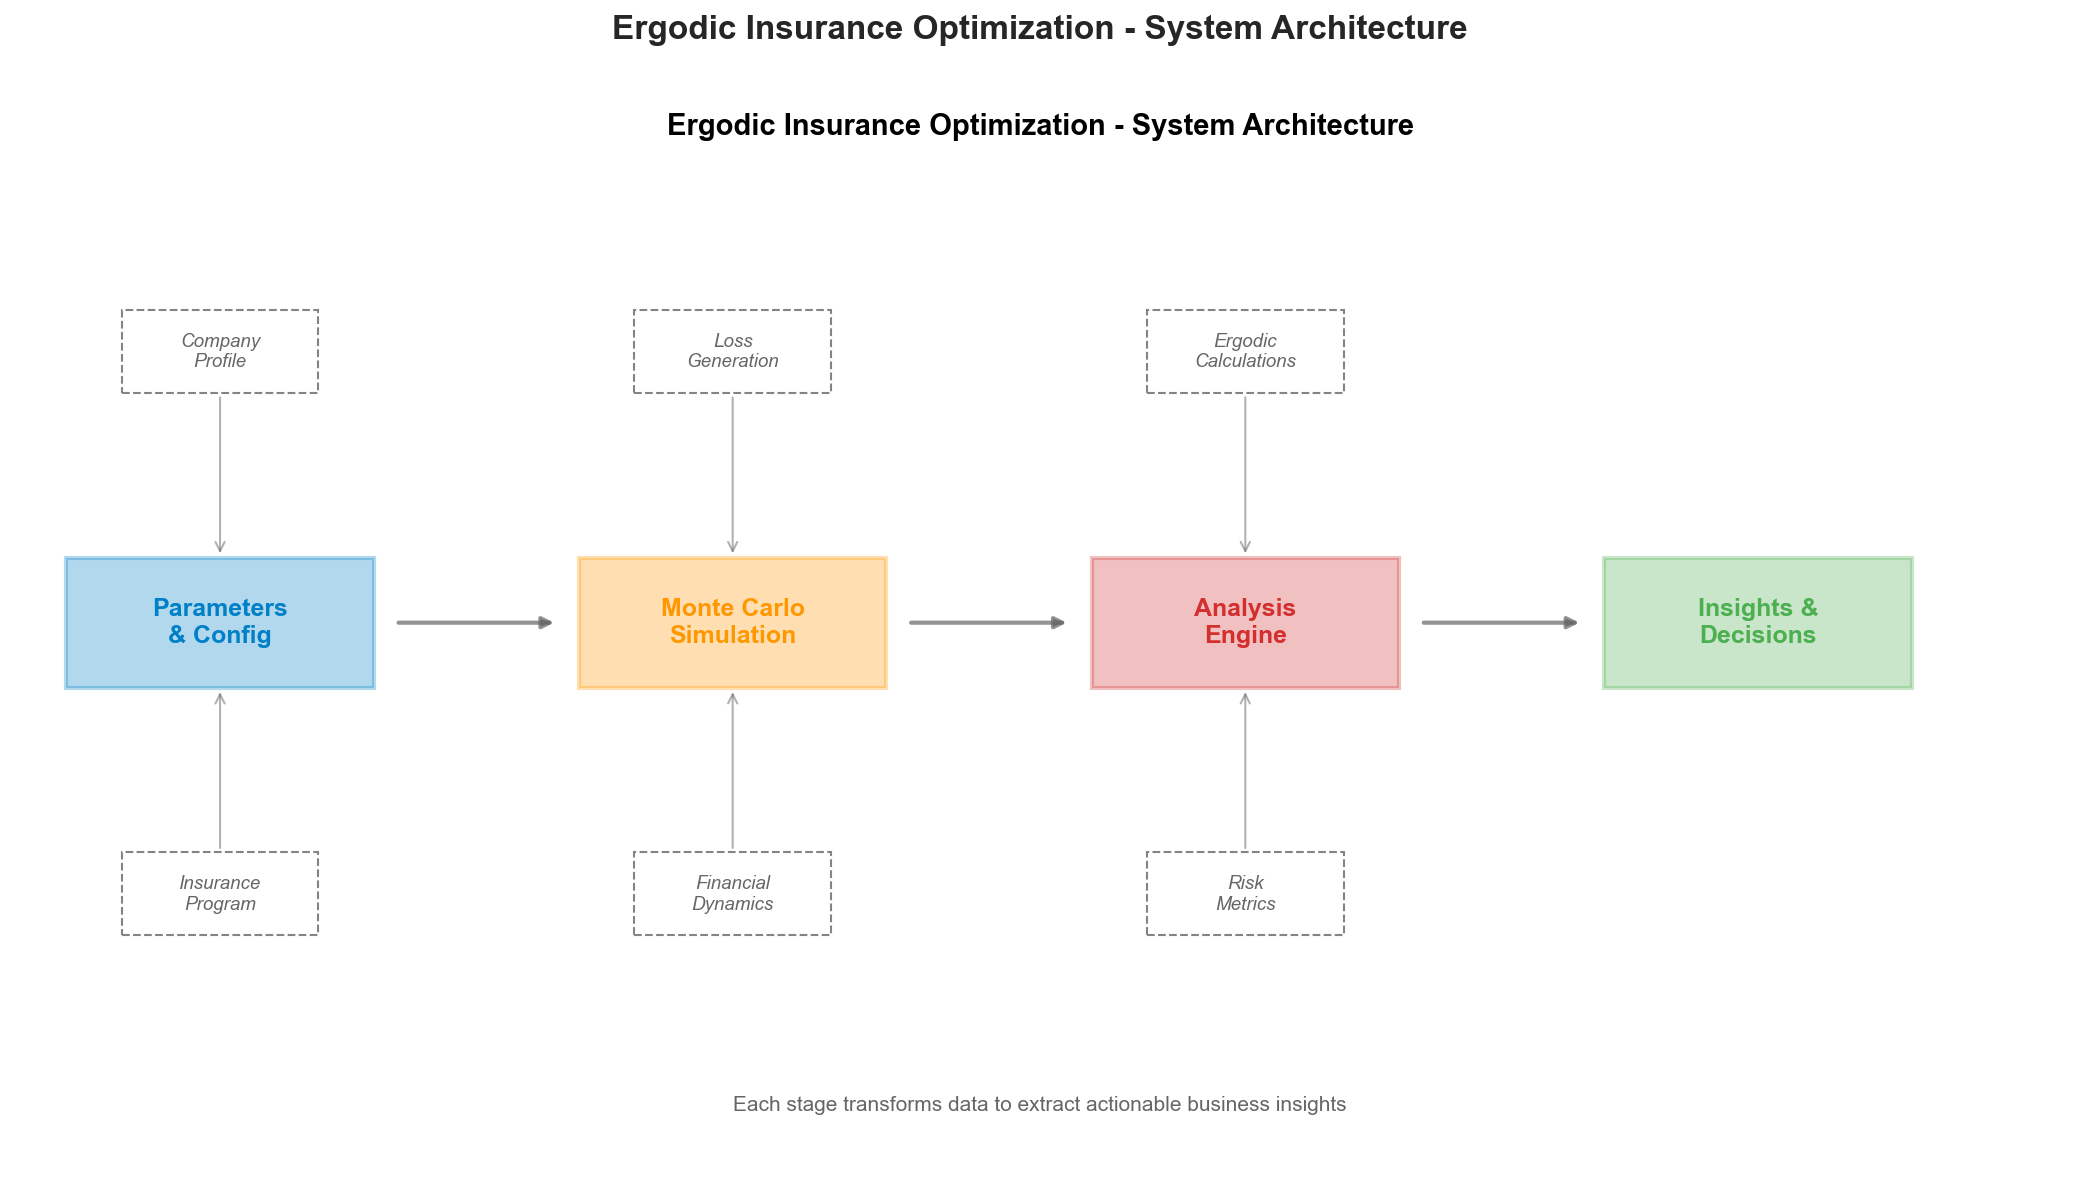
Simplified System Architecture
        flowchart LR
       %% Simplified Executive View
       INPUT[("📊 Market Data<br/>& Configuration")]
       BUSINESS[("🏭 Business<br/>Simulation")]
       ERGODIC[("📈 Ergodic<br/>Analysis")]
       OPTIMIZE[("🎯 Strategy<br/>Optimization")]
       OUTPUT[("📑 Reports &<br/>Insights")]

       INPUT --> BUSINESS
       BUSINESS --> ERGODIC
       ERGODIC --> OPTIMIZE
       OPTIMIZE --> OUTPUT

       %% Styling
       classDef inputStyle fill:#e3f2fd,stroke:#0d47a1,stroke-width:3px,font-size:14px
       classDef processStyle fill:#f3e5f5,stroke:#4a148c,stroke-width:3px,font-size:14px
       classDef outputStyle fill:#e8f5e9,stroke:#1b5e20,stroke-width:3px,font-size:14px

       class INPUT inputStyle
       class BUSINESS,ERGODIC,OPTIMIZE processStyle
       class OUTPUT outputStyle
Key Innovation: By comparing time-average growth (what one business experiences over time) with ensemble-average growth (statistical average across many businesses), the framework demonstrates that insurance fundamentally transforms the growth dynamics of volatile businesses.
System Architecture Overview (Detailed)
The actual implementation follows a sophisticated multi-layer architecture:
        graph TB
       %% Input Layer
       subgraph Inputs["📥 Input Layer"]
           CONF["Configuration<br/>(YAML/JSON)"]
           HIST["Historical Loss Data"]
           PARAMS["Business Parameters"]
       end

       %% Core Simulation
       subgraph Core["⚙️ Core Simulation Engine"]
           MANU["WidgetManufacturer<br/>(Business Model)"]
           CLAIM["ClaimGenerator<br/>(Loss Events)"]
           INS["InsuranceProgram<br/>(Coverage Tower)"]
           SIM["Simulation Engine<br/>(Time Evolution)"]
       end

       %% Analysis Layer
       subgraph Analysis["📊 Analysis & Optimization"]
           MONTE["Monte Carlo Engine<br/>(10,000+ paths)"]
           ERGODIC["Ergodic Analyzer<br/>(Time vs Ensemble)"]
           OPT["Business Optimizer<br/>(Strategy Selection)"]
           SENS["Sensitivity Analysis<br/>(Parameter Impact)"]
       end

       %% Output Layer
       subgraph Outputs["📤 Output & Insights"]
           EXCEL["Excel Reports<br/>(Detailed Results)"]
           VIZ["Visualizations<br/>(Executive & Technical)"]
           METRICS["Risk Metrics<br/>(VaR, CVaR, Ruin Prob)"]
           STRATEGY["Optimal Strategy<br/>(Limits & Retentions)"]
       end

       %% Data Flow
       Inputs --> Core
       Core --> MONTE
       MONTE --> Analysis
       Analysis --> Outputs

       %% Key Connections
       MANU -.-> INS
       CLAIM -.-> INS
       INS -.-> SIM
       SIM -.-> MONTE
       ERGODIC -.-> OPT
       OPT -.-> SENS

       classDef inputClass fill:#e3f2fd,stroke:#1565c0
       classDef coreClass fill:#fff3e0,stroke:#ef6c00
       classDef analysisClass fill:#f3e5f5,stroke:#7b1fa2
       classDef outputClass fill:#e8f5e9,stroke:#2e7d32

       class CONF,HIST,PARAMS inputClass
       class MANU,CLAIM,INS,SIM coreClass
       class MONTE,ERGODIC,OPT,SENS analysisClass
       class EXCEL,VIZ,METRICS,STRATEGY outputClass
Reference to System Architecture Diagram
For a visual representation, see: assets/system_architecture.png
The PNG diagram shows the simplified flow, while the detailed architecture above reflects the actual implementation with all major components.
Detailed System Architecture
This diagram shows the overall architecture of the Ergodic Insurance Limits framework, including the main components, external dependencies, and data flow between major modules.
        flowchart TB
       %% External Inputs and Configurations
       subgraph External["External Inputs"]
           CONFIG[("Configuration Files<br/>YAML/JSON")]
           MARKET[("Market Data<br/>Loss Distributions")]
           PARAMS[("Business Parameters<br/>Financial Metrics")]
       end

       %% Core System Components
       subgraph Core["Core Simulation Engine"]
           SIM["Simulation<br/>Engine"]
           MANU["Widget<br/>Manufacturer<br/>Model"]
           CLAIM["Claim<br/>Generator"]
           INS["Insurance<br/>Program"]
       end

       %% Analysis and Optimization
       subgraph Analysis["Analysis & Optimization"]
           ERGODIC["Ergodic<br/>Analyzer"]
           OPT["Business<br/>Optimizer"]
           MONTE["Monte Carlo<br/>Engine"]
           SENS["Sensitivity<br/>Analyzer"]
       end

       %% Validation and Testing
       subgraph Validation["Validation & Testing"]
           ACC["Accuracy<br/>Validator"]
           BACK["Strategy<br/>Backtester"]
           WALK["Walk-Forward<br/>Validator"]
           CONV["Convergence<br/>Monitor"]
       end

       %% Processing Infrastructure
       subgraph Infrastructure["Processing Infrastructure"]
           BATCH["Batch<br/>Processor"]
           PARALLEL["Parallel<br/>Executor"]
           CACHE["Smart<br/>Cache"]
           STORAGE["Trajectory<br/>Storage"]
       end

       %% Reporting and Visualization
       subgraph Output["Reporting & Visualization"]
           VIZ["Visualization<br/>Engine"]
           EXCEL["Excel<br/>Reporter"]
           STATS["Summary<br/>Statistics"]
           METRICS["Risk<br/>Metrics"]
       end

       %% Data Flow
       CONFIG --> SIM
       MARKET --> CLAIM
       PARAMS --> MANU

       SIM --> MANU
       SIM --> CLAIM
       SIM --> INS

       MANU <--> INS
       CLAIM --> INS

       SIM --> MONTE
       MONTE --> ERGODIC
       MONTE --> OPT

       ERGODIC --> SENS
       OPT --> SENS

       MONTE --> ACC
       MONTE --> BACK
       BACK --> WALK

       MONTE --> CONV
       CONV --> BATCH

       BATCH --> PARALLEL
       PARALLEL --> CACHE
       CACHE --> STORAGE

       ERGODIC --> VIZ
       OPT --> VIZ
       SENS --> VIZ

       STORAGE --> STATS
       STATS --> EXCEL
       STATS --> METRICS

       VIZ --> EXCEL

       %% Styling
       classDef external fill:#e1f5fe,stroke:#01579b,stroke-width:2px
       classDef core fill:#fff3e0,stroke:#e65100,stroke-width:2px
       classDef analysis fill:#f3e5f5,stroke:#4a148c,stroke-width:2px
       classDef validation fill:#e8f5e9,stroke:#1b5e20,stroke-width:2px
       classDef infra fill:#fce4ec,stroke:#880e4f,stroke-width:2px
       classDef output fill:#e0f2f1,stroke:#004d40,stroke-width:2px

       class CONFIG,MARKET,PARAMS external
       class SIM,MANU,CLAIM,INS core
       class ERGODIC,OPT,MONTE,SENS analysis
       class ACC,BACK,WALK,CONV validation
       class BATCH,PARALLEL,CACHE,STORAGE infra
       class VIZ,EXCEL,STATS,METRICS output
System Overview
The Ergodic Insurance Limits framework is designed as a modular, high-performance system for analyzing insurance purchasing decisions through the lens of ergodic theory. The architecture follows these key principles:
1. Separation of Concerns
Core Simulation: Handles the fundamental business and insurance mechanics
Analysis Layer: Provides ergodic and optimization capabilities
Infrastructure: Manages computational efficiency and data handling
Validation: Ensures accuracy and robustness of results
Output: Delivers insights through visualizations and reports
2. Data Flow Architecture
Configuration and market data flow into the simulation engine
Simulations generate trajectories processed by analysis modules
Infrastructure layers provide caching and parallelization
Results flow to visualization and reporting components
3. Key Interactions
The Simulation Engine orchestrates the time evolution of the business model
The Manufacturer Model interacts with the Insurance Program for claim processing
Monte Carlo Engine generates multiple scenarios for statistical analysis
Ergodic Analyzer compares time-average vs ensemble-average growth
Batch Processor and Parallel Executor enable high-performance computing
4. External Dependencies
The system integrates with:
NumPy/SciPy for numerical computations
Pandas for data manipulation
Matplotlib/Plotly for visualizations
OpenPyXL for Excel reporting
Multiprocessing for parallel execution
Key highlights:
9 Major Subsystems: Configuration, Financial Core, Insurance, Simulation, Analytics, Optimization, Results, Validation, and External I/O
50+ Modules: Comprehensive coverage of all system components
Clear Data Flows: Shows how information moves between subsystems
External Integrations: YAML configs, CSV exports, Jupyter notebooks, and Sphinx documentation
Module Dependencies and Relationships
The module overview diagram provides a detailed view of how the 50+ Python modules interact with each other, showing import relationships and dependency hierarchies.
Module Overview and Dependencies
This diagram shows the detailed module structure and dependencies within the Ergodic Insurance framework.
        graph LR
       %% Configuration Layer
       subgraph Config["Configuration Management"]
           CONFIG_BASE["config.py<br/>Base Configuration"]
           CONFIG_V2["config_v2.py<br/>Enhanced Config"]
           CONFIG_MGR["config_manager.py<br/>Config Manager"]
           CONFIG_LOADER["config_loader.py<br/>Config Loader"]
           CONFIG_COMPAT["config_compat.py<br/>Compatibility Layer"]
           CONFIG_MIG["config_migrator.py<br/>Migration Tools"]
       end

       %% Core Business Logic
       subgraph Business["Business Logic"]
           MANUFACTURER["manufacturer.py<br/>Widget Manufacturer"]
           INSURANCE["insurance.py<br/>Insurance Policy"]
           INS_PROGRAM["insurance_program.py<br/>Insurance Program"]
           INS_PRICING["insurance_pricing.py<br/>Pricing Models"]
           CLAIM_GEN["claim_generator.py<br/>Claim Events"]
           CLAIM_DEV["claim_development.py<br/>Claim Development"]
           EXPOSURE["exposure_base.py<br/>Exposure Models"]
       end

       %% Simulation Engine
       subgraph Simulation["Simulation Core"]
           SIM_CORE["simulation.py<br/>Main Engine"]
           MONTE_CARLO["monte_carlo.py<br/>Monte Carlo"]
           MONTE_WORKER["monte_carlo_worker.py<br/>MC Worker"]
           STOCHASTIC["stochastic_processes.py<br/>Stochastic Models"]
           LOSS_DIST["loss_distributions.py<br/>Loss Distributions"]
       end

       %% Analysis Tools
       subgraph Analysis["Analysis & Optimization"]
           ERGODIC_ANALYZER["ergodic_analyzer.py<br/>Ergodic Analysis"]
           BUSINESS_OPT["business_optimizer.py<br/>Optimization"]
           DECISION_ENGINE["decision_engine.py<br/>Decision Making"]
           OPTIMIZATION["optimization.py<br/>Optimization Algos"]
           HJB_SOLVER["hjb_solver.py<br/>HJB Equations"]
           OPTIMAL_CTRL["optimal_control.py<br/>Control Theory"]
       end

       %% Validation & Testing
       subgraph Validation["Validation"]
           ACCURACY_VAL["accuracy_validator.py<br/>Accuracy Checks"]
           STRATEGY_BACK["strategy_backtester.py<br/>Backtesting"]
           WALK_FORWARD["walk_forward_validator.py<br/>Walk-Forward"]
           VALIDATION_METRICS["validation_metrics.py<br/>Metrics"]
           STATISTICAL_TESTS["statistical_tests.py<br/>Statistical Tests"]
       end

       %% Risk Analysis
       subgraph Risk["Risk Analysis"]
           RISK_METRICS["risk_metrics.py<br/>Risk Metrics"]
           RUIN_PROB["ruin_probability.py<br/>Ruin Analysis"]
           SENSITIVITY["sensitivity.py<br/>Sensitivity Analysis"]
           SENS_VIZ["sensitivity_visualization.py<br/>Sensitivity Viz"]
           PARETO["pareto_frontier.py<br/>Pareto Analysis"]
           BOOTSTRAP["bootstrap_analysis.py<br/>Bootstrap Methods"]
       end

       %% Performance & Infrastructure
       subgraph Infrastructure["Infrastructure"]
           BATCH_PROC["batch_processor.py<br/>Batch Processing"]
           PARALLEL_EXEC["parallel_executor.py<br/>Parallelization"]
           PERF_OPT["performance_optimizer.py<br/>Performance"]
           TRAJ_STORAGE["trajectory_storage.py<br/>Data Storage"]
           PROGRESS_MON["progress_monitor.py<br/>Progress Tracking"]
           PARAM_SWEEP["parameter_sweep.py<br/>Parameter Sweeps"]
       end

       %% Reporting & Visualization
       subgraph Reporting["Reporting & Visualization"]
           VIZ_LEGACY["visualization_legacy.py<br/>Legacy Plots"]
           EXCEL_REPORT["excel_reporter.py<br/>Excel Reports"]
           SUMMARY_STATS["summary_statistics.py<br/>Statistics"]
           RESULT_AGG["result_aggregator.py<br/>Aggregation"]
           FINANCIAL_STMT["financial_statements.py<br/>Statements"]
       end

       %% Visualization Submodule
       subgraph VizModule["visualization/"]
           VIZ_CORE["core.py<br/>Core Functions"]
           VIZ_EXEC["executive_plots.py<br/>Executive Views"]
           VIZ_TECH["technical_plots.py<br/>Technical Views"]
           VIZ_ANNOT["annotations.py<br/>Annotations"]
           VIZ_STYLE["style_manager.py<br/>Styling"]
           VIZ_FACTORY["figure_factory.py<br/>Figure Factory"]
           VIZ_EXPORT["export.py<br/>Export Tools"]
           VIZ_BATCH["batch_plots.py<br/>Batch Plotting"]
           VIZ_INTERACT["interactive_plots.py<br/>Interactive Plots"]
           VIZ_TOWER["improved_tower_plot.py<br/>Tower Plots"]
       end

       %% Reporting Submodule
       subgraph ReportModule["reporting/"]
           REP_BUILDER["report_builder.py<br/>Report Builder"]
           REP_EXEC["executive_report.py<br/>Executive Reports"]
           REP_TECH["technical_report.py<br/>Technical Reports"]
           REP_SCENARIO["scenario_comparator.py<br/>Scenario Compare"]
           REP_TABLE["table_generator.py<br/>Table Generator"]
           REP_INSIGHT["insight_extractor.py<br/>Insights"]
           REP_FORMAT["formatters.py<br/>Formatters"]
           REP_CACHE["cache_manager.py<br/>Cache Manager"]
           REP_VALID["validator.py<br/>Report Validator"]
           REP_CONFIG["config.py<br/>Report Config"]
       end

       %% Advanced Features
       subgraph Advanced["Advanced Features"]
           CONVERGENCE["convergence.py<br/>Convergence"]
           CONV_ADV["convergence_advanced.py<br/>Advanced Conv."]
           CONV_PLOTS["convergence_plots.py<br/>Conv. Plots"]
           ADAPTIVE_STOP["adaptive_stopping.py<br/>Adaptive Stopping"]
           SCENARIO_MGR["scenario_manager.py<br/>Scenarios"]
           BENCHMARKING["benchmarking.py<br/>Benchmarks"]
       end

       %% Key Dependencies
       CONFIG_BASE --> MANUFACTURER
       CONFIG_V2 --> CONFIG_MGR
       CONFIG_MGR --> CONFIG_LOADER
       CONFIG_COMPAT --> CONFIG_MGR

       MANUFACTURER --> SIM_CORE
       INSURANCE --> INS_PROGRAM
       INS_PRICING --> INS_PROGRAM
       CLAIM_GEN --> SIM_CORE
       CLAIM_DEV --> CLAIM_GEN
       EXPOSURE --> MANUFACTURER

       SIM_CORE --> MONTE_CARLO
       MONTE_CARLO --> MONTE_WORKER
       STOCHASTIC --> MONTE_CARLO
       LOSS_DIST --> CLAIM_GEN

       MONTE_CARLO --> ERGODIC_ANALYZER
       ERGODIC_ANALYZER --> BUSINESS_OPT
       BUSINESS_OPT --> DECISION_ENGINE

       MONTE_CARLO --> ACCURACY_VAL
       STRATEGY_BACK --> WALK_FORWARD

       ERGODIC_ANALYZER --> RISK_METRICS
       RISK_METRICS --> RUIN_PROB
       SENSITIVITY --> PARETO
       SENSITIVITY --> SENS_VIZ

       BATCH_PROC --> PARALLEL_EXEC
       PARALLEL_EXEC --> MONTE_CARLO

       RESULT_AGG --> SUMMARY_STATS
       SUMMARY_STATS --> EXCEL_REPORT
       FINANCIAL_STMT --> EXCEL_REPORT

       VIZ_CORE --> VIZ_FACTORY
       VIZ_STYLE --> VIZ_EXEC
       VIZ_STYLE --> VIZ_TECH
       VIZ_FACTORY --> VIZ_EXPORT
       VIZ_BATCH --> VIZ_CORE
       VIZ_INTERACT --> VIZ_CORE
       VIZ_TOWER --> VIZ_STYLE

       REP_BUILDER --> REP_EXEC
       REP_BUILDER --> REP_TECH
       REP_SCENARIO --> REP_TABLE
       REP_INSIGHT --> REP_EXEC
       REP_FORMAT --> REP_TABLE
       REP_CACHE --> REP_BUILDER
       REP_VALID --> REP_BUILDER

       %% Styling
       classDef config fill:#e3f2fd,stroke:#1565c0,stroke-width:2px
       classDef business fill:#fff9c4,stroke:#f57f17,stroke-width:2px
       classDef simulation fill:#f3e5f5,stroke:#6a1b9a,stroke-width:2px
       classDef analysis fill:#e8f5e9,stroke:#2e7d32,stroke-width:2px
       classDef validation fill:#fce4ec,stroke:#c2185b,stroke-width:2px
       classDef risk fill:#fff3e0,stroke:#ef6c00,stroke-width:2px
       classDef infra fill:#e0f2f1,stroke:#00695c,stroke-width:2px
       classDef reporting fill:#f1f8e9,stroke:#558b2f,stroke-width:2px
       classDef viz fill:#e1f5fe,stroke:#0277bd,stroke-width:2px
       classDef report fill:#fff8e1,stroke:#f9a825,stroke-width:2px
       classDef advanced fill:#fafafa,stroke:#424242,stroke-width:2px

       class CONFIG_BASE,CONFIG_V2,CONFIG_MGR,CONFIG_LOADER,CONFIG_COMPAT,CONFIG_MIG config
       class MANUFACTURER,INSURANCE,INS_PROGRAM,INS_PRICING,CLAIM_GEN,CLAIM_DEV,EXPOSURE business
       class SIM_CORE,MONTE_CARLO,MONTE_WORKER,STOCHASTIC,LOSS_DIST simulation
       class ERGODIC_ANALYZER,BUSINESS_OPT,DECISION_ENGINE,OPTIMIZATION,HJB_SOLVER,OPTIMAL_CTRL analysis
       class ACCURACY_VAL,STRATEGY_BACK,WALK_FORWARD,VALIDATION_METRICS,STATISTICAL_TESTS validation
       class RISK_METRICS,RUIN_PROB,SENSITIVITY,SENS_VIZ,PARETO,BOOTSTRAP risk
       class BATCH_PROC,PARALLEL_EXEC,PERF_OPT,TRAJ_STORAGE,PROGRESS_MON,PARAM_SWEEP infra
       class VIZ_LEGACY,EXCEL_REPORT,SUMMARY_STATS,RESULT_AGG,FINANCIAL_STMT reporting
       class VIZ_CORE,VIZ_EXEC,VIZ_TECH,VIZ_ANNOT,VIZ_STYLE,VIZ_FACTORY,VIZ_EXPORT,VIZ_BATCH,VIZ_INTERACT,VIZ_TOWER viz
       class REP_BUILDER,REP_EXEC,REP_TECH,REP_SCENARIO,REP_TABLE,REP_INSIGHT,REP_FORMAT,REP_CACHE,REP_VALID,REP_CONFIG report
       class CONVERGENCE,CONV_ADV,CONV_PLOTS,ADAPTIVE_STOP,SCENARIO_MGR,BENCHMARKING advanced
Module Categories
Configuration Management
Handles all configuration aspects including loading, validation, migration, and compatibility between different configuration versions.
Business Logic
Core business domain models including the manufacturer, insurance policies, pricing, and claim processing.
Simulation Core
The main simulation engine that orchestrates time evolution, Monte Carlo runs, and stochastic processes.
Analysis & Optimization
Advanced analytical tools including ergodic analysis, business optimization, and decision-making engines.
Validation
Comprehensive validation framework for ensuring accuracy and robustness of simulations.
Risk Analysis
Specialized risk assessment tools including ruin probability, sensitivity analysis, and bootstrap methods.
Infrastructure
High-performance computing infrastructure for parallel processing, caching, and data management.
Reporting & Visualization
Output generation including Excel reports, visualizations, and statistical summaries.
Advanced Features
Sophisticated features for convergence monitoring, adaptive stopping, and benchmarking.
Module organization:
Core Financial (4 modules): Central business logic and financial modeling
Insurance & Risk (5 modules): Insurance structures and risk management
Simulation (5 modules): Monte Carlo engine and parallel execution
Analytics (10 modules): Statistical analysis and metrics calculation
Optimization (6 modules): Strategy optimization and control theory
Results (7 modules): Reporting and visualization
Validation (7 modules): Testing and performance validation
Configuration (6 modules): Parameter management and settings
Class Diagrams
Detailed class structures are organized into three main categories:
Core Classes
The core classes diagram shows the fundamental building blocks of the system, including financial models, insurance structures, and simulation components.
Core Classes Diagram
This diagram shows the main classes and their relationships in the core simulation engine.
        classDiagram
    %% Core Simulation Classes
    class Simulation {
        -config: Config
        -manufacturer: WidgetManufacturer
        -claim_generator: ClaimGenerator
        -insurance_program: InsuranceProgram
        +run() SimulationResults
        +step(year: int) dict
        +process_claims(claims: List[ClaimEvent])
        +check_solvency() bool
    }

    class SimulationResults {
        +years: ndarray
        +assets: ndarray
        +equity: ndarray
        +roe: ndarray
        +revenue: ndarray
        +net_income: ndarray
        +claim_counts: ndarray
        +claim_amounts: ndarray
        +insolvency_year: Optional[int]
        +to_dataframe() DataFrame
        +calculate_time_weighted_roe() float
        +calculate_rolling_roe(window: int) ndarray
    }

    class MonteCarloEngine {
        -config: Config
        -n_simulations: int
        -parallel_executor: ParallelExecutor
        -trajectory_storage: TrajectoryStorage
        +run_simulations(n: int) List[SimulationResults]
        +run_parallel(n_workers: int) List[SimulationResults]
        +aggregate_results(results: List) dict
        +calculate_convergence() ConvergenceMetrics
    }

    %% Business Model Classes
    class WidgetManufacturer {
        -config: ManufacturerConfig
        -assets: float
        -equity: float
        -liabilities: float
        -claim_liabilities: List[ClaimLiability]
        +calculate_revenue() float
        +calculate_operating_income() float
        +process_insurance_claim(amount, deductible, limit) tuple
        +step(working_capital_pct, growth_rate) dict
        +apply_dividends(retention_ratio: float)
        +update_balance_sheet()
        +is_solvent() bool
    }

    class ClaimLiability {
        +total_amount: float
        +payment_schedule: List[float]
        +years_remaining: int
        +get_annual_payment() float
        +advance_year()
    }

    %% Insurance Classes
    class InsurancePolicy {
        +deductible: float
        +limit: float
        +premium: float
        +coverage_type: str
        +calculate_payout(loss: float) float
        +calculate_retained_loss(loss: float) float
    }

    class InsuranceProgram {
        -policies: List[InsurancePolicy]
        -total_premium: float
        -letter_of_credit_rate: float
        +add_policy(policy: InsurancePolicy)
        +calculate_total_premium() float
        +process_claim(amount: float) ClaimResult
        +get_coverage_tower() List[dict]
        +calculate_effective_retention() float
    }

    class ClaimResult {
        +total_loss: float
        +company_payment: float
        +insurance_payment: float
        +by_policy: List[PolicyPayout]
    }

    %% Claim Generation
    class ClaimGenerator {
        -frequency_dist: Distribution
        -severity_dist: Distribution
        -random_state: RandomState
        +generate_claims(year: int) List[ClaimEvent]
        +set_seed(seed: int)
        +calibrate_to_historical(data: LossData)
    }

    class ClaimEvent {
        +year: int
        +amount: float
        +cause: str
        +severity_level: str
        +timestamp: float
    }

    %% Configuration
    class Config {
        +simulation: SimulationConfig
        +manufacturer: ManufacturerConfig
        +insurance: InsuranceConfig
        +monte_carlo: MonteCarloConfig
        +validate()
        +to_dict() dict
        +from_dict(data: dict) Config
    }

    class ManufacturerConfig {
        +initial_assets: float
        +asset_turnover_ratio: float
        +base_operating_margin: float
        +tax_rate: float
        +retention_ratio: float
        +target_leverage: float
    }

    %% Relationships
    Simulation --> WidgetManufacturer : uses
    Simulation --> ClaimGenerator : uses
    Simulation --> InsuranceProgram : uses
    Simulation --> SimulationResults : produces

    MonteCarloEngine --> Simulation : runs multiple
    MonteCarloEngine --> SimulationResults : aggregates

    WidgetManufacturer --> ClaimLiability : manages
    WidgetManufacturer --> InsuranceProgram : interacts with

    InsuranceProgram --> InsurancePolicy : contains
    InsuranceProgram --> ClaimResult : produces

    ClaimGenerator --> ClaimEvent : generates

    Config --> ManufacturerConfig : contains
    Simulation --> Config : configured by
Class Interactions
        sequenceDiagram
    participant MC as MonteCarloEngine
    participant S as Simulation
    participant M as Manufacturer
    participant CG as ClaimGenerator
    participant IP as InsuranceProgram
    participant SR as SimulationResults

    MC->>S: Initialize simulation
    S->>M: Create manufacturer
    S->>CG: Create claim generator
    S->>IP: Setup insurance program

    loop Each Year
        S->>CG: Generate claims
        CG-->>S: List[ClaimEvent]

        loop Each Claim
            S->>IP: Process claim
            IP->>M: Calculate payout
            M-->>IP: Company/insurance split
            IP-->>S: ClaimResult
        end

        S->>M: Step forward (growth, operations)
        M->>M: Update balance sheet
        M-->>S: Financial metrics

        S->>S: Check solvency
        alt Insolvent
            S-->>MC: Early termination
        end
    end

    S->>SR: Compile results
    SR-->>MC: SimulationResults
    MC->>MC: Aggregate all paths
Key Design Patterns
1. Strategy Pattern
Insurance strategies can be swapped dynamically
Different optimization algorithms can be plugged in
2. Builder Pattern
Configuration objects use builder pattern for complex initialization
SimulationResults built incrementally during simulation
3. Observer Pattern
Progress monitoring observes simulation progress
Convergence monitors observe Monte Carlo iterations
4. Factory Pattern
ClaimGenerator acts as factory for ClaimEvents
FigureFactory creates visualization objects
5. Facade Pattern
MonteCarloEngine provides simplified interface to complex parallel execution
InsuranceProgram facades complex multi-policy interactions
Key components:
WidgetManufacturer: Central financial model with balance sheet evolution
StochasticProcess: Abstract base for various volatility models (GBM, OU, Lognormal)
InsuranceProgram: Multi-layer insurance structure implementation
ClaimGenerator: Loss event generation with configurable distributions
Data Models
The data models diagram illustrates configuration structures, result objects, and data transfer objects used throughout the system.
Data Models and Analysis Classes
This diagram shows the data structures and analysis models used throughout the system.
        classDiagram
    %% Ergodic Analysis Models
    class ErgodicAnalyzer {
        -convergence_threshold: float
        -min_paths: int
        -confidence_level: float
        +analyze_trajectory(trajectory: ndarray) ErgodicData
        +compare_scenarios(insured: List, uninsured: List) dict
        +calculate_ergodic_metrics(data: ErgodicData) dict
        +validate_insurance_impact() ValidationResults
        +plot_ergodic_comparison()
    }

    class ErgodicData {
        +trajectory: ndarray
        +time_points: ndarray
        +time_average: float
        +ensemble_average: float
        +growth_rate: float
        +volatility: float
        +survival_rate: float
        +calculate_time_average() float
        +calculate_ensemble_average() float
        +calculate_ergodic_divergence() float
    }

    class ErgodicAnalysisResults {
        +insured_metrics: dict
        +uninsured_metrics: dict
        +ergodic_advantage: dict
        +confidence_intervals: dict
        +convergence_metrics: ConvergenceMetrics
        +to_dataframe() DataFrame
        +plot_results()
    }

    %% Optimization Models
    class BusinessOptimizer {
        -objective: BusinessObjective
        -constraints: BusinessConstraints
        -algorithm: OptimizationAlgorithm
        +optimize(initial_guess: dict) OptimalStrategy
        +run_pareto_analysis() ParetoFrontier
        +sensitivity_analysis() SensitivityResult
    }

    class OptimalStrategy {
        +insurance_limit: float
        +retention: float
        +premium_budget: float
        +expected_growth: float
        +risk_metrics: dict
        +implementation_steps: List[str]
    }

    class BusinessObjective {
        +metric: str
        +target_value: float
        +weight: float
        +evaluate(simulation_results: SimulationResults) float
    }

    class BusinessConstraints {
        +min_equity: float
        +max_leverage: float
        +min_liquidity: float
        +max_premium_ratio: float
        +validate(state: dict) bool
    }

    %% Risk Metrics
    class RiskMetrics {
        +value_at_risk: float
        +conditional_value_at_risk: float
        +expected_shortfall: float
        +maximum_drawdown: float
        +sharpe_ratio: float
        +sortino_ratio: float
        +calculate_var(returns: ndarray, confidence: float) float
        +calculate_cvar(returns: ndarray, confidence: float) float
        +calculate_max_drawdown(equity: ndarray) float
    }

    class RuinProbability {
        +threshold: float
        +time_horizon: int
        +probability: float
        +expected_time_to_ruin: float
        +calculate_ruin_prob(trajectories: List) float
        +estimate_recovery_time() float
    }

    %% Convergence and Validation
    class ConvergenceMetrics {
        +mean_estimate: float
        +std_estimate: float
        +confidence_interval: tuple
        +effective_sample_size: int
        +gelman_rubin_stat: float
        +is_converged: bool
        +plot_convergence()
    }

    class ValidationResults {
        +accuracy_metrics: dict
        +statistical_tests: dict
        +edge_cases: List[dict]
        +performance_benchmarks: dict
        +is_valid: bool
        +generate_report() str
    }

    %% Sensitivity Analysis
    class SensitivityAnalyzer {
        -base_params: dict
        -param_ranges: dict
        -n_samples: int
        +run_one_way_analysis(param: str) SensitivityResult
        +run_two_way_analysis(param1: str, param2: str) TwoWaySensitivityResult
        +run_sobol_analysis() SobolIndices
        +plot_tornado_diagram()
    }

    class SensitivityResult {
        +parameter: str
        +values: ndarray
        +outputs: ndarray
        +elasticity: float
        +critical_threshold: float
        +plot()
    }

    %% Financial Statements
    class FinancialStatements {
        +balance_sheet: BalanceSheet
        +income_statement: IncomeStatement
        +cash_flow: CashFlowStatement
        +ratios: FinancialRatios
        +generate_statements(manufacturer: WidgetManufacturer)
        +export_to_excel(path: str)
    }

    class BalanceSheet {
        +assets: dict
        +liabilities: dict
        +equity: dict
        +total_assets: float
        +total_liabilities: float
        +total_equity: float
        +validate_balance() bool
    }

    class IncomeStatement {
        +revenue: float
        +operating_income: float
        +insurance_expense: float
        +tax_expense: float
        +net_income: float
        +ebitda: float
        +calculate_margins() dict
    }

    %% Loss Distributions
    class LossDistribution {
        +distribution_type: str
        +parameters: dict
        +fitted: bool
        +fit(data: ndarray)
        +sample(n: int) ndarray
        +pdf(x: float) float
        +cdf(x: float) float
        +quantile(p: float) float
    }

    class LossData {
        +historical_losses: DataFrame
        +frequency_data: ndarray
        +severity_data: ndarray
        +exposure_base: float
        +clean_data()
        +fit_distributions() dict
        +validate_fit() bool
    }

    %% Relationships
    ErgodicAnalyzer --> ErgodicData : creates
    ErgodicAnalyzer --> ErgodicAnalysisResults : produces
    ErgodicAnalyzer --> ValidationResults : validates with

    BusinessOptimizer --> OptimalStrategy : finds
    BusinessOptimizer --> BusinessObjective : uses
    BusinessOptimizer --> BusinessConstraints : respects

    OptimalStrategy --> RiskMetrics : includes

    SensitivityAnalyzer --> SensitivityResult : produces

    FinancialStatements --> BalanceSheet : contains
    FinancialStatements --> IncomeStatement : contains

    LossDistribution --> LossData : fitted from

    ErgodicAnalysisResults --> ConvergenceMetrics : includes
    ValidationResults --> RiskMetrics : uses
Data Flow Sequence
        sequenceDiagram
    participant Sim as Simulation
    participant EA as ErgodicAnalyzer
    participant BO as BusinessOptimizer
    participant SA as SensitivityAnalyzer
    participant RM as RiskMetrics
    participant FS as FinancialStatements

    Sim->>EA: Trajectory data
    EA->>EA: Calculate time averages
    EA->>EA: Calculate ensemble averages
    EA->>RM: Request risk metrics
    RM-->>EA: VaR, CVaR, Sharpe
    EA-->>BO: Ergodic metrics

    BO->>BO: Define objective
    BO->>BO: Set constraints
    BO->>SA: Request sensitivity
    SA->>SA: Parameter sweep
    SA-->>BO: Sensitivity results
    BO-->>BO: Find optimal strategy

    BO->>FS: Generate statements
    FS->>FS: Build balance sheet
    FS->>FS: Build income statement
    FS-->>BO: Financial reports
Key Data Patterns
1. Immutable Data Objects
Results objects are immutable after creation
Ensures data integrity through analysis pipeline
2. Lazy Evaluation
Metrics calculated on-demand
Caching of expensive computations
3. Composite Pattern
FinancialStatements composed of multiple statement types
ErgodicAnalysisResults aggregates multiple metric types
4. Template Method
Base distribution class with template methods
Subclasses implement specific distributions
5. Data Transfer Objects (DTO)
Result classes act as DTOs between modules
Clean separation of data and logic
Key structures:
ConfigV2: Modern Pydantic-based configuration with validation
SimulationResults: Comprehensive result aggregation
ValidationMetrics: Performance and accuracy metrics
StateManagement: System state and progress tracking
Service Layer
The service layer diagram shows high-level services that orchestrate the core components, including analytics, optimization, and validation services.
Service Layer and Infrastructure
This diagram shows the service layer components that provide infrastructure support for the core simulation and analysis.
        classDiagram
    %% Batch Processing Services
    class BatchProcessor {
        -config: BatchConfig
        -executor: ParallelExecutor
        -cache: SmartCache
        -progress_monitor: ProgressMonitor
        +process_scenarios(scenarios: List) BatchResults
        +process_parameter_sweep(params: dict) SweepResults
        +process_convergence_study() ConvergenceResults
        +resume_from_checkpoint(checkpoint_id: str)
    }

    class ParallelExecutor {
        -n_workers: int
        -chunk_size: int
        -backend: str
        -memory_limit: float
        +map(func: Callable, items: List) List
        +map_reduce(map_func, reduce_func, items) Any
        +scatter_gather(tasks: List) List
        +get_worker_status() dict
    }

    class SmartCache {
        -cache_dir: Path
        -max_size_gb: float
        -ttl_hours: int
        -compression: bool
        +get(key: str) Optional[Any]
        +set(key: str, value: Any)
        +invalidate(pattern: str)
        +get_stats() CacheStats
    }

    %% Progress and Monitoring
    class ProgressMonitor {
        -total_tasks: int
        -completed_tasks: int
        -start_time: float
        -update_interval: float
        +update(progress: float, message: str)
        +estimate_time_remaining() float
        +get_throughput() float
        +display_progress_bar()
    }

    class ConvergenceMonitor {
        -metrics: List[float]
        -threshold: float
        -window_size: int
        -patience: int
        +add_metric(value: float)
        +check_convergence() bool
        +get_convergence_rate() float
        +plot_convergence_history()
    }

    %% Trajectory Storage
    class TrajectoryStorage {
        -storage_backend: str
        -compression_level: int
        -chunk_size: int
        +store_trajectory(sim_id: str, data: ndarray)
        +load_trajectory(sim_id: str) ndarray
        +store_batch(trajectories: dict)
        +query_trajectories(filter: dict) List
        +get_storage_stats() dict
    }

    %% Parameter Management
    class ParameterSweep {
        -base_params: dict
        -sweep_params: dict
        -sweep_type: str
        -n_points: int
        +generate_grid() List[dict]
        +generate_latin_hypercube() List[dict]
        +generate_sobol_sequence() List[dict]
        +adaptive_sampling(results: List) List[dict]
    }

    class ScenarioManager {
        -scenarios: Dict[str, Scenario]
        -active_scenario: str
        +add_scenario(name: str, params: dict)
        +load_scenario(name: str) Scenario
        +compare_scenarios(names: List[str]) ComparisonResults
        +export_scenarios(path: str)
    }

    %% Performance Optimization
    class PerformanceOptimizer {
        -profiler: cProfile
        -memory_profiler: MemoryProfiler
        -optimization_level: int
        +profile_function(func: Callable) ProfileResult
        +optimize_memory_usage()
        +enable_numba_jit()
        +vectorize_operations()
        +get_bottlenecks() List[Bottleneck]
    }

    class VectorizedOperations {
        <<static>>
        +calculate_returns(prices: ndarray) ndarray
        +calculate_drawdowns(equity: ndarray) ndarray
        +calculate_rolling_stats(data: ndarray, window: int) dict
        +apply_vectorized_claim(claims: ndarray, limits: ndarray) ndarray
    }

    %% Benchmarking
    class BenchmarkSuite {
        -benchmarks: List[Benchmark]
        -baseline_results: dict
        -comparison_results: dict
        +add_benchmark(benchmark: Benchmark)
        +run_all_benchmarks() BenchmarkResults
        +compare_implementations(impl1, impl2) ComparisonReport
        +generate_performance_report() str
    }

    class Benchmark {
        +name: str
        +setup_func: Callable
        +test_func: Callable
        +teardown_func: Callable
        +n_iterations: int
        +run() BenchmarkResult
    }

    %% Validation Services
    class AccuracyValidator {
        -tolerance: float
        -reference_impl: ReferenceImplementations
        +validate_calculation(func, inputs, expected) bool
        +validate_convergence(results: List) bool
        +validate_edge_cases() ValidationReport
        +cross_validate(method1, method2) float
    }

    class StrategyBacktester {
        -historical_data: DataFrame
        -strategy: InsuranceStrategy
        -metrics: List[str]
        +backtest(start_date, end_date) BacktestResults
        +walk_forward_analysis(window_size: int) WalkForwardResults
        +calculate_performance_metrics() dict
        +generate_backtest_report() str
    }

    %% Reporting Services
    class ExcelReporter {
        -template_path: str
        -output_path: str
        -workbook: Workbook
        +create_summary_sheet(results: dict)
        +create_charts(data: DataFrame)
        +add_sensitivity_tables(sensitivity: SensitivityResult)
        +add_risk_metrics(metrics: RiskMetrics)
        +format_report()
        +save()
    }

    class ResultAggregator {
        -results: List[SimulationResults]
        -aggregation_funcs: dict
        +add_results(results: SimulationResults)
        +calculate_statistics() SummaryStatistics
        +calculate_percentiles(percentiles: List) dict
        +group_by(key: str) Dict[str, List]
        +export_aggregated_data(format: str)
    }

    %% Visualization Services
    class FigureFactory {
        -style_manager: StyleManager
        -default_size: tuple
        -dpi: int
        +create_line_plot(data: DataFrame) Figure
        +create_distribution_plot(data: ndarray) Figure
        +create_heatmap(data: ndarray) Figure
        +create_dashboard(results: dict) Figure
        +save_figure(fig: Figure, path: str)
    }

    class StyleManager {
        -theme: Theme
        -color_palette: List[str]
        -font_settings: dict
        +apply_theme(theme: Theme)
        +get_color_cycle() List
        +format_axis(ax: Axes)
        +add_annotations(ax: Axes, annotations: List)
    }

    %% Relationships
    BatchProcessor --> ParallelExecutor : uses
    BatchProcessor --> SmartCache : caches with
    BatchProcessor --> ProgressMonitor : monitors with

    ParallelExecutor --> VectorizedOperations : optimizes with

    ParameterSweep --> ScenarioManager : generates for

    PerformanceOptimizer --> VectorizedOperations : creates
    PerformanceOptimizer --> BenchmarkSuite : benchmarks with

    BenchmarkSuite --> Benchmark : runs

    AccuracyValidator --> StrategyBacktester : validates

    ResultAggregator --> ExcelReporter : feeds
    ResultAggregator --> FigureFactory : visualizes with

    FigureFactory --> StyleManager : styled by

    BatchProcessor --> TrajectoryStorage : stores in
    ConvergenceMonitor --> ProgressMonitor : reports to
Service Interaction Flow
        sequenceDiagram
    participant Client
    participant BP as BatchProcessor
    participant PE as ParallelExecutor
    participant SC as SmartCache
    participant TS as TrajectoryStorage
    participant PM as ProgressMonitor
    participant RA as ResultAggregator
    participant ER as ExcelReporter

    Client->>BP: Submit batch job
    BP->>SC: Check cache
    alt Cache hit
        SC-->>BP: Cached results
        BP-->>Client: Return results
    else Cache miss
        BP->>PM: Initialize monitor
        BP->>PE: Distribute work

        loop Parallel execution
            PE->>PE: Process chunk
            PE->>PM: Update progress
            PM-->>Client: Progress update
        end

        PE-->>BP: Raw results
        BP->>TS: Store trajectories
        BP->>SC: Cache results
        BP->>RA: Aggregate results
        RA->>ER: Generate report
        ER-->>Client: Excel report
        BP-->>Client: Complete results
    end
Service Layer Patterns
1. Service Locator Pattern
Central registry for service discovery
Dynamic service binding at runtime
2. Repository Pattern
TrajectoryStorage abstracts data persistence
ScenarioManager provides scenario repository
3. Unit of Work Pattern
BatchProcessor coordinates complex operations
Ensures consistency across service calls
4. Pipeline Pattern
Data flows through processing pipeline
Each service transforms data for next stage
5. Decorator Pattern
ProgressMonitor decorates long-running operations
SmartCache decorates expensive computations
6. Adapter Pattern
ExcelReporter adapts results to Excel format
Different storage backends adapted by TrajectoryStorage
Service categories:
Analytics Services: ErgodicAnalyzer, RiskMetrics, ConvergenceDiagnostics
Optimization Services: BusinessOptimizer, HJBSolver, ParetoFrontier
Simulation Services: MonteCarloEngine, ParallelExecutor, BatchProcessor
Validation Services: WalkForwardValidator, StrategyBacktester, BenchmarkSuite
Design Patterns
The architecture employs several well-established design patterns:
Pattern |
Implementation |
|---|---|
Factory Pattern |
ConfigManager creates appropriate configuration objects |
Strategy Pattern |
StochasticProcess implementations (GBM, OU, Lognormal) |
Observer Pattern |
ProgressMonitor with callbacks for real-time updates |
Template Method |
LossDistribution abstract base class |
Adapter Pattern |
ConfigCompat bridges v1 and v2 configurations |
Singleton Pattern |
ConfigManager ensures single configuration instance |
Command Pattern |
BatchProcessor queues and executes simulation tasks |
Composite Pattern |
InsuranceProgram composes multiple InsuranceLayers |
Repository Pattern |
TrajectoryStorage abstracts data persistence |
Chain of Responsibility |
ResultAggregator chains for hierarchical processing |
Performance Architecture
The system is designed for high-performance computation:
Operation |
Target |
Status |
|---|---|---|
1000-year simulation |
< 1 minute |
✅ Achieved |
100K Monte Carlo iterations |
< 10 minutes |
✅ Achieved |
1M iterations |
Overnight |
✅ Achieved |
Memory per trajectory |
< 1MB |
✅ Optimized |
Parallel efficiency |
> 80% |
✅ Verified |
Key Architectural Decisions
Modular Design: Each module has a single, well-defined responsibility
Configuration-Driven: All parameters externalized through Pydantic models
Parallel Processing: CPU-optimized execution for large-scale simulations
Ergodic Theory Integration: Core differentiation through time vs ensemble analysis
Extensible Plugin Architecture: New components without modifying core
85+% Test Coverage: Comprehensive testing across all modules