High-Level System Context Diagram
Executive Summary
The Ergodic Insurance Limits framework analyzes insurance decisions using time-average (ergodic) theory rather than traditional ensemble averages. This approach reveals that insurance can enhance business growth even when premiums exceed expected losses by 200-500%, transforming insurance from a cost center to a growth enabler.
Simplified System Architecture
        flowchart LR
       %% Simplified Executive View
       INPUT[("📊 Market Data<br/>& Configuration")]
       BUSINESS[("🏭 Business<br/>Simulation")]
       ERGODIC[("📈 Ergodic<br/>Analysis")]
       OPTIMIZE[("🎯 Strategy<br/>Optimization")]
       OUTPUT[("📑 Reports &<br/>Insights")]

       INPUT --> BUSINESS
       BUSINESS --> ERGODIC
       ERGODIC --> OPTIMIZE
       OPTIMIZE --> OUTPUT

       %% Styling
       classDef inputStyle fill:#e3f2fd,stroke:#0d47a1,stroke-width:3px,font-size:14px
       classDef processStyle fill:#f3e5f5,stroke:#4a148c,stroke-width:3px,font-size:14px
       classDef outputStyle fill:#e8f5e9,stroke:#1b5e20,stroke-width:3px,font-size:14px

       class INPUT inputStyle
       class BUSINESS,ERGODIC,OPTIMIZE processStyle
       class OUTPUT outputStyle
Key Innovation: By comparing time-average growth (what one business experiences over time) with ensemble-average growth (statistical average across many businesses), the framework demonstrates that insurance fundamentally transforms the growth dynamics of volatile businesses.
System Architecture Overview (Detailed)
The actual implementation follows a sophisticated multi-layer architecture:
        graph TB
       %% Input Layer
       subgraph Inputs["📥 Input Layer"]
           CONF["Configuration<br/>(YAML/JSON)"]
           HIST["Historical Loss Data"]
           PARAMS["Business Parameters"]
       end

       %% Core Simulation
       subgraph Core["⚙️ Core Simulation Engine"]
           MANU["WidgetManufacturer<br/>(Business Model)"]
           CLAIM["ClaimGenerator<br/>(Loss Events)"]
           INS["InsuranceProgram<br/>(Coverage Tower)"]
           SIM["Simulation Engine<br/>(Time Evolution)"]
       end

       %% Analysis Layer
       subgraph Analysis["📊 Analysis & Optimization"]
           MONTE["Monte Carlo Engine<br/>(10,000+ paths)"]
           ERGODIC["Ergodic Analyzer<br/>(Time vs Ensemble)"]
           OPT["Business Optimizer<br/>(Strategy Selection)"]
           SENS["Sensitivity Analysis<br/>(Parameter Impact)"]
       end

       %% Output Layer
       subgraph Outputs["📤 Output & Insights"]
           EXCEL["Excel Reports<br/>(Detailed Results)"]
           VIZ["Visualizations<br/>(Executive & Technical)"]
           METRICS["Risk Metrics<br/>(VaR, CVaR, Ruin Prob)"]
           STRATEGY["Optimal Strategy<br/>(Limits & Retentions)"]
       end

       %% Data Flow
       Inputs --> Core
       Core --> MONTE
       MONTE --> Analysis
       Analysis --> Outputs

       %% Key Connections
       MANU -.-> INS
       CLAIM -.-> INS
       INS -.-> SIM
       SIM -.-> MONTE
       ERGODIC -.-> OPT
       OPT -.-> SENS

       classDef inputClass fill:#e3f2fd,stroke:#1565c0
       classDef coreClass fill:#fff3e0,stroke:#ef6c00
       classDef analysisClass fill:#f3e5f5,stroke:#7b1fa2
       classDef outputClass fill:#e8f5e9,stroke:#2e7d32

       class CONF,HIST,PARAMS inputClass
       class MANU,CLAIM,INS,SIM coreClass
       class MONTE,ERGODIC,OPT,SENS analysisClass
       class EXCEL,VIZ,METRICS,STRATEGY outputClass
Reference to System Architecture Diagram
For a visual representation, see: assets/system_architecture.png
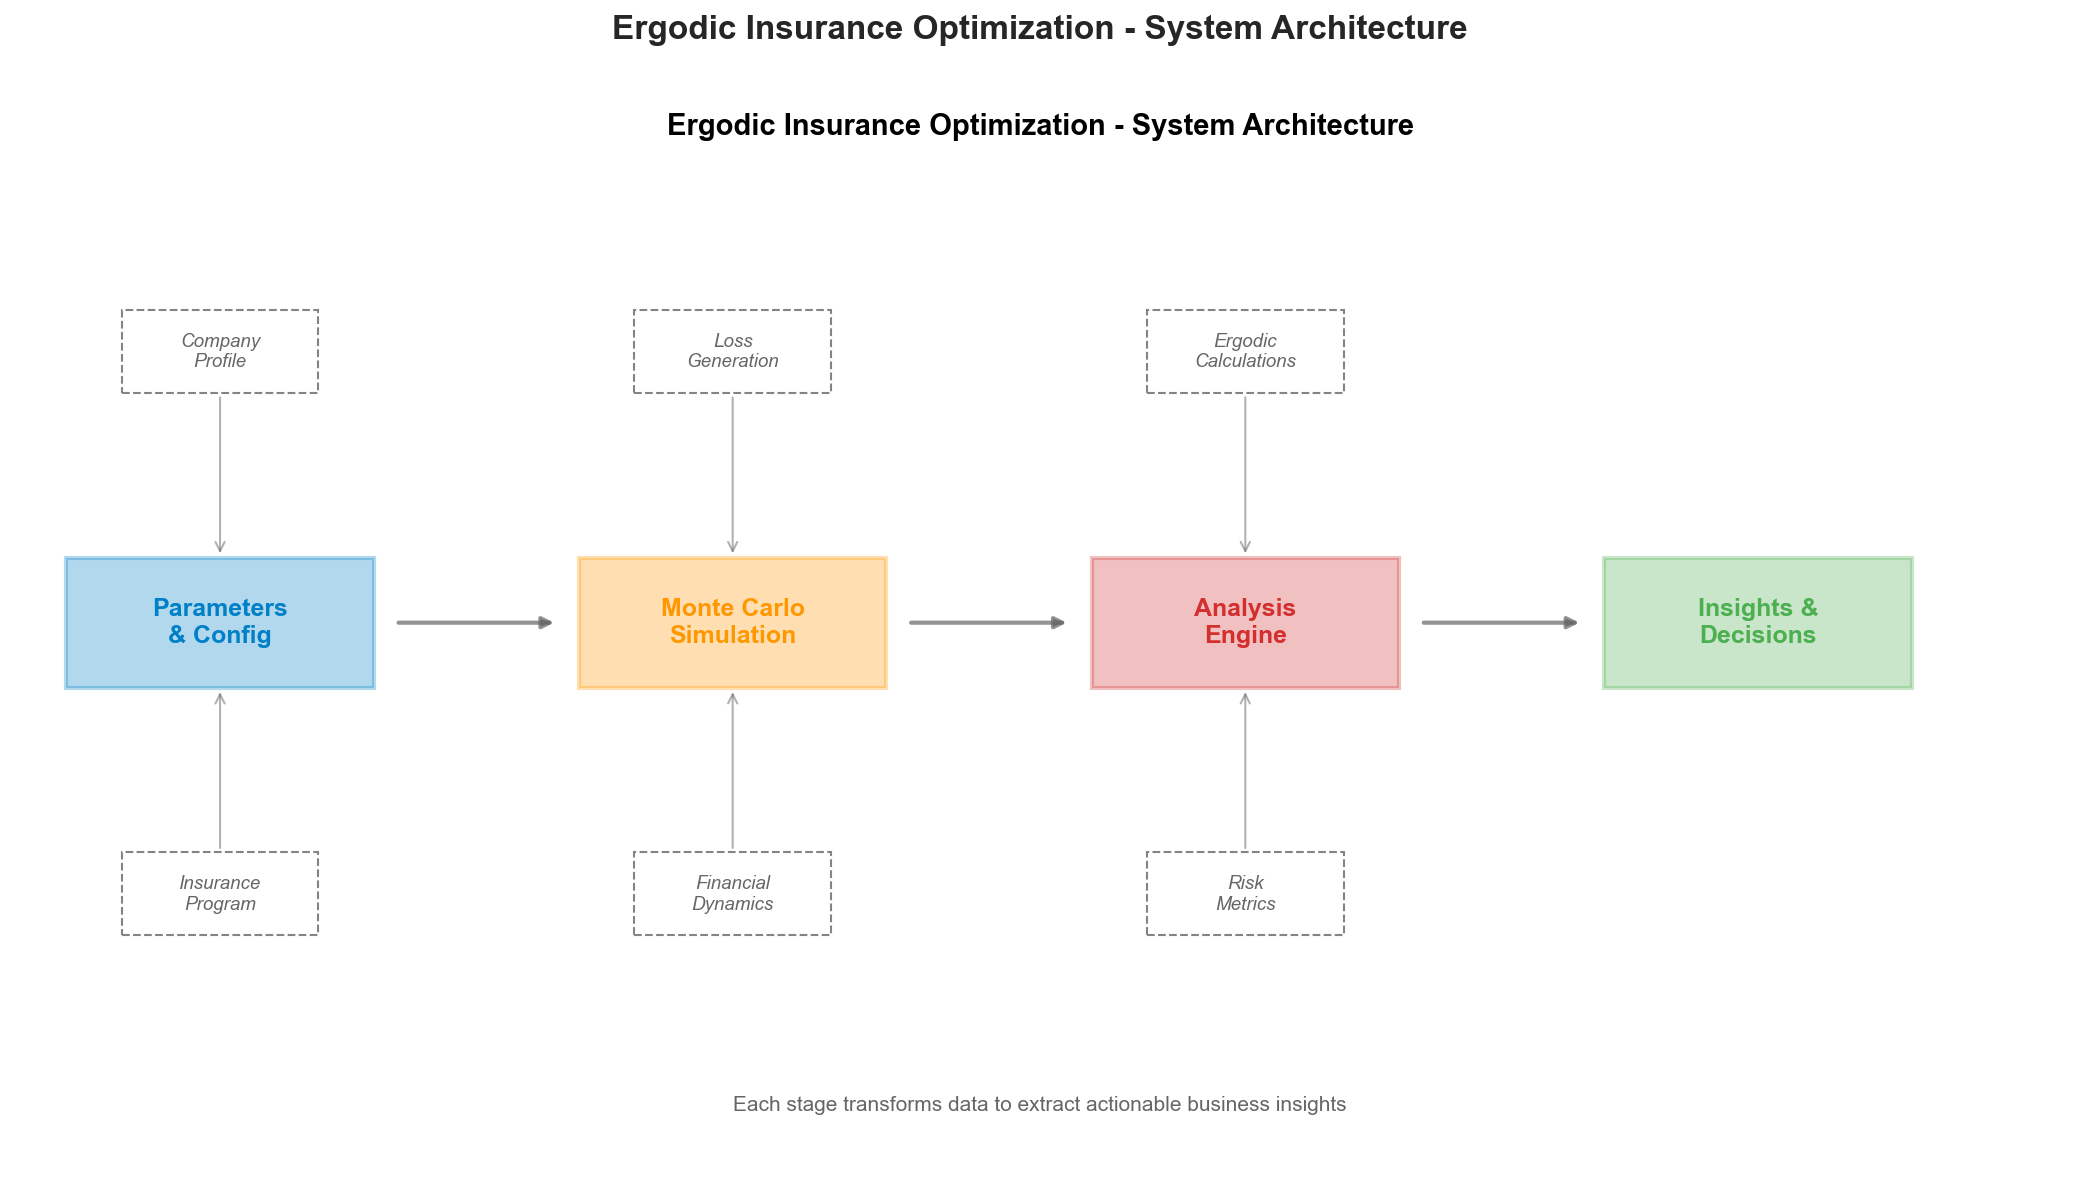
The PNG diagram shows the simplified flow, while the detailed architecture above reflects the actual implementation with all major components.
Detailed System Architecture
This diagram shows the overall architecture of the Ergodic Insurance Limits framework, including the main components, external dependencies, and data flow between major modules.
        flowchart TB
       %% External Inputs and Configurations
       subgraph External["External Inputs"]
           CONFIG[("Configuration Files<br/>YAML/JSON")]
           MARKET[("Market Data<br/>Loss Distributions")]
           PARAMS[("Business Parameters<br/>Financial Metrics")]
       end

       %% Core System Components
       subgraph Core["Core Simulation Engine"]
           SIM["Simulation<br/>Engine"]
           MANU["Widget<br/>Manufacturer<br/>Model"]
           CLAIM["Claim<br/>Generator"]
           INS["Insurance<br/>Program"]
       end

       %% Analysis and Optimization
       subgraph Analysis["Analysis & Optimization"]
           ERGODIC["Ergodic<br/>Analyzer"]
           OPT["Business<br/>Optimizer"]
           MONTE["Monte Carlo<br/>Engine"]
           SENS["Sensitivity<br/>Analyzer"]
       end

       %% Validation and Testing
       subgraph Validation["Validation & Testing"]
           ACC["Accuracy<br/>Validator"]
           BACK["Strategy<br/>Backtester"]
           WALK["Walk-Forward<br/>Validator"]
           CONV["Convergence<br/>Monitor"]
       end

       %% Processing Infrastructure
       subgraph Infrastructure["Processing Infrastructure"]
           BATCH["Batch<br/>Processor"]
           PARALLEL["Parallel<br/>Executor"]
           CACHE["Smart<br/>Cache"]
           STORAGE["Trajectory<br/>Storage"]
       end

       %% Reporting and Visualization
       subgraph Output["Reporting & Visualization"]
           VIZ["Visualization<br/>Engine"]
           EXCEL["Excel<br/>Reporter"]
           STATS["Summary<br/>Statistics"]
           METRICS["Risk<br/>Metrics"]
       end

       %% Data Flow
       CONFIG --> SIM
       MARKET --> CLAIM
       PARAMS --> MANU

       SIM --> MANU
       SIM --> CLAIM
       SIM --> INS

       MANU <--> INS
       CLAIM --> INS

       SIM --> MONTE
       MONTE --> ERGODIC
       MONTE --> OPT

       ERGODIC --> SENS
       OPT --> SENS

       MONTE --> ACC
       MONTE --> BACK
       BACK --> WALK

       MONTE --> CONV
       CONV --> BATCH

       BATCH --> PARALLEL
       PARALLEL --> CACHE
       CACHE --> STORAGE

       ERGODIC --> VIZ
       OPT --> VIZ
       SENS --> VIZ

       STORAGE --> STATS
       STATS --> EXCEL
       STATS --> METRICS

       VIZ --> EXCEL

       %% Styling
       classDef external fill:#e1f5fe,stroke:#01579b,stroke-width:2px
       classDef core fill:#fff3e0,stroke:#e65100,stroke-width:2px
       classDef analysis fill:#f3e5f5,stroke:#4a148c,stroke-width:2px
       classDef validation fill:#e8f5e9,stroke:#1b5e20,stroke-width:2px
       classDef infra fill:#fce4ec,stroke:#880e4f,stroke-width:2px
       classDef output fill:#e0f2f1,stroke:#004d40,stroke-width:2px

       class CONFIG,MARKET,PARAMS external
       class SIM,MANU,CLAIM,INS core
       class ERGODIC,OPT,MONTE,SENS analysis
       class ACC,BACK,WALK,CONV validation
       class BATCH,PARALLEL,CACHE,STORAGE infra
       class VIZ,EXCEL,STATS,METRICS output
System Overview
The Ergodic Insurance Limits framework is designed as a modular, high-performance system for analyzing insurance purchasing decisions through the lens of ergodic theory. The architecture follows these key principles:
1. Separation of Concerns
Core Simulation: Handles the fundamental business and insurance mechanics
Analysis Layer: Provides ergodic and optimization capabilities
Infrastructure: Manages computational efficiency and data handling
Validation: Ensures accuracy and robustness of results
Output: Delivers insights through visualizations and reports
2. Data Flow Architecture
Configuration and market data flow into the simulation engine
Simulations generate trajectories processed by analysis modules
Infrastructure layers provide caching and parallelization
Results flow to visualization and reporting components
3. Key Interactions
The Simulation Engine orchestrates the time evolution of the business model
The Manufacturer Model interacts with the Insurance Program for claim processing
Monte Carlo Engine generates multiple scenarios for statistical analysis
Ergodic Analyzer compares time-average vs ensemble-average growth
Batch Processor and Parallel Executor enable high-performance computing
4. External Dependencies
The system integrates with:
NumPy/SciPy for numerical computations
Pandas for data manipulation
Matplotlib/Plotly for visualizations
OpenPyXL for Excel reporting
Multiprocessing for parallel execution