Architectural Diagrams
This section provides comprehensive architectural visualizations of the Ergodic Insurance Limits system using interactive Mermaid diagrams. These diagrams illustrate the system’s structure, module relationships, data flows, and design patterns.
Note
The diagrams are interactive - you can zoom, pan, and click on elements for better viewing. If diagrams don’t render properly, try refreshing the page or viewing in a modern browser.
Understanding the Notation
Boxes: Represent classes, modules, or components
Arrows: Show dependencies, data flow, or relationships
Colors: Group related components (consistent across diagrams)
Labels: Describe the nature of relationships
Overview
The architecture documentation is organized into three main categories:
System-Level Views - High-level architecture and module relationships
Class Diagrams - Detailed class structures and interactions
Data Flow Patterns - How information moves through the system
High-Level System Context
The system context diagram shows the overall architecture, including all major components, external systems, and data flows. The system is organized into 9 major subsystems with over 50 modules.
High-Level System Context Diagram
Executive Summary
The Ergodic Insurance Limits framework analyzes insurance decisions using time-average (ergodic) theory rather than traditional ensemble averages. This approach reveals that insurance can enhance business growth even when premiums exceed expected losses by 200-500%, transforming insurance from a cost center to a growth enabler.
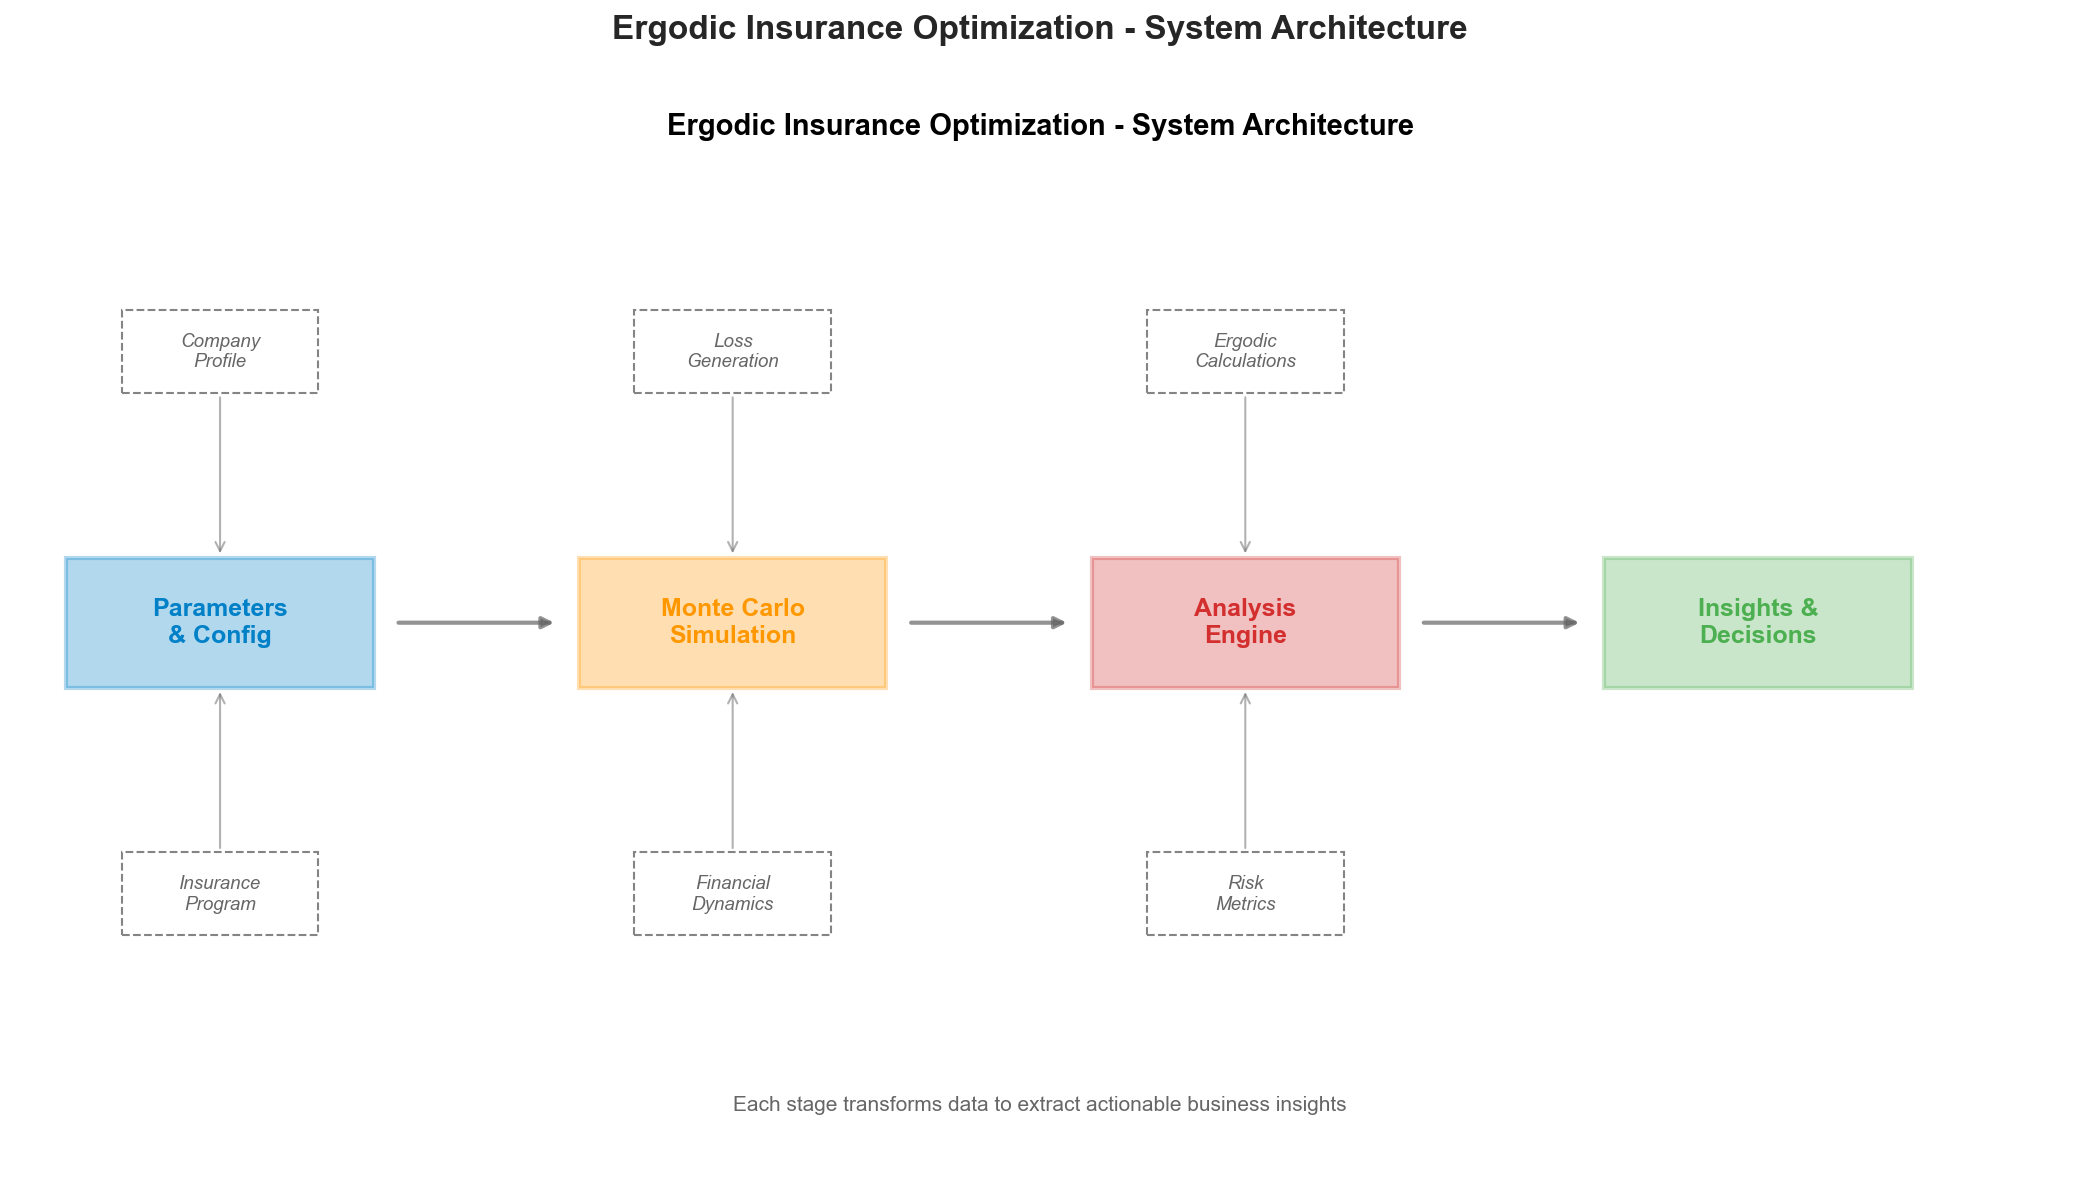
Simplified System Architecture
        flowchart LR
       %% Simplified Executive View
       INPUT[("📊 Market Data<br/>& Configuration")]
       BUSINESS[("🏭 Business<br/>Simulation")]
       ERGODIC[("📈 Ergodic<br/>Analysis")]
       OPTIMIZE[("🎯 Strategy<br/>Optimization")]
       OUTPUT[("📑 Reports &<br/>Insights")]

       INPUT --> BUSINESS
       BUSINESS --> ERGODIC
       ERGODIC --> OPTIMIZE
       OPTIMIZE --> OUTPUT

       %% Styling
       classDef inputStyle fill:#e3f2fd,stroke:#0d47a1,stroke-width:3px,font-size:14px
       classDef processStyle fill:#f3e5f5,stroke:#4a148c,stroke-width:3px,font-size:14px
       classDef outputStyle fill:#e8f5e9,stroke:#1b5e20,stroke-width:3px,font-size:14px

       class INPUT inputStyle
       class BUSINESS,ERGODIC,OPTIMIZE processStyle
       class OUTPUT outputStyle
Key Innovation: By comparing time-average growth (what one business experiences over time) with ensemble-average growth (statistical average across many businesses), the framework demonstrates that insurance fundamentally transforms the growth dynamics of volatile businesses.
System Architecture Overview (Detailed)
The actual implementation follows a sophisticated multi-layer architecture:
        graph TB
       %% Input Layer
       subgraph Inputs["📥 Input Layer"]
           CONF["Configuration<br/>(YAML/JSON)"]
           HIST["Historical Loss Data"]
           PARAMS["Business Parameters"]
       end

       %% Core Simulation
       subgraph Core["⚙️ Core Simulation Engine"]
           MANU["WidgetManufacturer<br/>(Business Model)"]
           LOSSG["ManufacturingLossGenerator<br/>(Loss Events)"]
           INS["InsuranceProgram<br/>(Coverage Tower)"]
           SIM["Simulation Engine<br/>(Time Evolution)"]
       end

       %% Financial Core
       subgraph Financial["💰 Financial Core"]
           LEDGER["Ledger<br/>(Double-Entry Accounting)"]
           ACCRUAL["AccrualManager<br/>(Accrual Timing)"]
           INSACCT["InsuranceAccounting<br/>(Premium Amortization)"]
           TAXH["TaxHandler<br/>(Tax Calculations)"]
           DECUTIL["decimal_utils<br/>(Decimal Precision)"]
       end

       %% Analysis Layer
       subgraph Analysis["📊 Analysis & Optimization"]
           MONTE["Monte Carlo Engine<br/>(10,000+ paths)"]
           ERGODIC["Ergodic Analyzer<br/>(Time vs Ensemble)"]
           OPT["Business Optimizer<br/>(Strategy Selection)"]
           SENS["Sensitivity Analysis<br/>(Parameter Impact)"]
       end

       %% Output Layer
       subgraph Outputs["📤 Output & Insights"]
           EXCEL["Excel Reports<br/>(Detailed Results)"]
           VIZ["Visualizations<br/>(Executive & Technical)"]
           METRICS["Risk Metrics<br/>(VaR, CVaR, Ruin Prob)"]
           STRATEGY["Optimal Strategy<br/>(Limits & Retentions)"]
       end

       %% Data Flow
       Inputs --> Core
       Core --> MONTE
       MONTE --> Analysis
       Analysis --> Outputs

       %% Key Connections
       MANU -.-> INS
       LOSSG -.-> INS
       INS -.-> SIM
       SIM -.-> MONTE
       ERGODIC -.-> OPT
       OPT -.-> SENS

       %% Financial Core Connections
       MANU --> LEDGER
       MANU --> ACCRUAL
       MANU --> INSACCT
       TAXH --> ACCRUAL
       LEDGER --> DECUTIL
       ACCRUAL --> DECUTIL
       INSACCT --> DECUTIL

       classDef inputClass fill:#e3f2fd,stroke:#1565c0
       classDef coreClass fill:#fff3e0,stroke:#ef6c00
       classDef financialClass fill:#fff9c4,stroke:#f9a825
       classDef analysisClass fill:#f3e5f5,stroke:#7b1fa2
       classDef outputClass fill:#e8f5e9,stroke:#2e7d32

       class CONF,HIST,PARAMS inputClass
       class MANU,LOSSG,INS,SIM coreClass
       class LEDGER,ACCRUAL,INSACCT,TAXH,DECUTIL financialClass
       class MONTE,ERGODIC,OPT,SENS analysisClass
       class EXCEL,VIZ,METRICS,STRATEGY outputClass
Reference to System Architecture Diagram
For a visual representation, see: assets/system_architecture.png
The PNG diagram shows the simplified flow, while the detailed architecture above reflects the actual implementation with all major components.
Detailed System Architecture
This diagram shows the overall architecture of the Ergodic Insurance Limits framework, including the main components, external dependencies, and data flow between major modules.
        flowchart TB
       %% External Inputs and Configurations
       subgraph External["External Inputs"]
           CONFIG[("Configuration Files<br/>YAML/JSON")]
           MARKET[("Market Data<br/>Loss Distributions")]
           PARAMS[("Business Parameters<br/>Financial Metrics")]
       end

       %% Core System Components
       subgraph Core["Core Simulation Engine"]
           SIM["Simulation<br/>Engine"]
           MANU["Widget<br/>Manufacturer<br/>Model"]
           LOSSG["Manufacturing<br/>Loss Generator"]
           INS["Insurance<br/>Program"]
       end

       %% Financial Accounting Subsystem
       subgraph FinAcct["Financial Accounting Subsystem"]
           LEDGER["Ledger<br/>(Double-Entry)"]
           ACCRUAL["AccrualManager<br/>(GAAP Timing)"]
           INSACCT["InsuranceAccounting<br/>(Premium & Recovery)"]
           TAXH["TaxHandler<br/>(Tax Accruals)"]
           DECUTIL["decimal_utils<br/>(Precision)"]
       end

       %% Insurance Subsystem
       subgraph InsuranceSub["Insurance Subsystem"]
           INSPOL["InsurancePolicy<br/>(Deprecated)"]
           INSLAY["InsuranceLayer<br/>(Deprecated)"]
           INSPROG["InsuranceProgram<br/>(Primary)"]
           ENHLAY["EnhancedInsuranceLayer<br/>(Primary)"]
           PRICER["InsurancePricer<br/>(Market Cycles)"]
       end

       %% Exposure & Trend System
       subgraph ExposureSub["Exposure & Trend System"]
           EXPBASE["ExposureBase<br/>(Dynamic Frequency)"]
           FSPROV["FinancialStateProvider<br/>(Protocol)"]
           TRENDS["trends.py<br/>(Trend Analysis)"]
       end

       %% Analysis and Optimization
       subgraph Analysis["Analysis & Optimization"]
           ERGODIC["Ergodic<br/>Analyzer"]
           OPT["Business<br/>Optimizer"]
           MONTE["Monte Carlo<br/>Engine"]
           SENS["Sensitivity<br/>Analyzer"]
       end

       %% Validation and Testing
       subgraph Validation["Validation & Testing"]
           ACC["Accuracy<br/>Validator"]
           BACK["Strategy<br/>Backtester"]
           WALK["Walk-Forward<br/>Validator"]
           CONV["Convergence<br/>Monitor"]
       end

       %% Processing Infrastructure
       subgraph Infrastructure["Processing Infrastructure"]
           BATCH["Batch<br/>Processor"]
           PARALLEL["Parallel<br/>Executor"]
           CACHE["Smart<br/>Cache"]
           STORAGE["Trajectory<br/>Storage"]
       end

       %% Reporting and Visualization
       subgraph Output["Reporting & Visualization"]
           VIZ["Visualization<br/>Engine"]
           EXCEL["Excel<br/>Reporter"]
           STATS["Summary<br/>Statistics"]
           METRICS["Risk<br/>Metrics"]
       end

       %% Data Flow - Input to Core
       CONFIG --> SIM
       MARKET --> LOSSG
       PARAMS --> MANU

       %% Core orchestration
       SIM --> MANU
       SIM --> LOSSG
       SIM --> INS

       MANU <--> INS
       LOSSG --> INS

       %% Manufacturer to Financial Accounting
       MANU --> LEDGER
       MANU --> ACCRUAL
       MANU --> INSACCT
       TAXH --> ACCRUAL
       LEDGER --> DECUTIL
       ACCRUAL --> DECUTIL
       INSACCT --> DECUTIL

       %% Insurance subsystem relationships
       INSPOL --> INSLAY
       INSPROG --> ENHLAY
       PRICER --> INSPROG
       PRICER --> INSPOL
       INS -.-> INSPROG
       INS -.-> INSPOL

       %% Exposure system
       EXPBASE --> FSPROV
       MANU -.-> FSPROV
       TRENDS --> LOSSG

       %% Core to Analysis
       SIM --> MONTE
       MONTE --> ERGODIC
       MONTE --> OPT

       ERGODIC --> SENS
       OPT --> SENS

       %% Validation
       MONTE --> ACC
       MONTE --> BACK
       BACK --> WALK

       MONTE --> CONV
       CONV --> BATCH

       %% Infrastructure
       BATCH --> PARALLEL
       PARALLEL --> CACHE
       CACHE --> STORAGE

       %% Output
       ERGODIC --> VIZ
       OPT --> VIZ
       SENS --> VIZ

       STORAGE --> STATS
       STATS --> EXCEL
       STATS --> METRICS

       VIZ --> EXCEL

       %% Styling
       classDef external fill:#e1f5fe,stroke:#01579b,stroke-width:2px
       classDef core fill:#fff3e0,stroke:#e65100,stroke-width:2px
       classDef financial fill:#fff9c4,stroke:#f9a825,stroke-width:2px
       classDef insurance fill:#ffe0b2,stroke:#e65100,stroke-width:2px
       classDef exposure fill:#f3e5f5,stroke:#6a1b9a,stroke-width:2px
       classDef analysis fill:#f3e5f5,stroke:#4a148c,stroke-width:2px
       classDef validation fill:#e8f5e9,stroke:#1b5e20,stroke-width:2px
       classDef infra fill:#fce4ec,stroke:#880e4f,stroke-width:2px
       classDef output fill:#e0f2f1,stroke:#004d40,stroke-width:2px

       class CONFIG,MARKET,PARAMS external
       class SIM,MANU,LOSSG,INS core
       class LEDGER,ACCRUAL,INSACCT,TAXH,DECUTIL financial
       class INSPOL,INSLAY,INSPROG,ENHLAY,PRICER insurance
       class EXPBASE,FSPROV,TRENDS exposure
       class ERGODIC,OPT,MONTE,SENS analysis
       class ACC,BACK,WALK,CONV validation
       class BATCH,PARALLEL,CACHE,STORAGE infra
       class VIZ,EXCEL,STATS,METRICS output
System Overview
The Ergodic Insurance Limits framework is designed as a modular, high-performance system for analyzing insurance purchasing decisions through the lens of ergodic theory. The architecture follows these key principles:
1. Separation of Concerns
Core Simulation: Handles the fundamental business and insurance mechanics
Financial Accounting: Provides double-entry ledger, accrual accounting, insurance accounting, and tax handling – all using Python’s
Decimaltype for precisionInsurance Subsystem: Provides
InsuranceProgramwithEnhancedInsuranceLayerfor coverage modeling, with market-cycle-aware pricing viaInsurancePricer. (The legacyInsurancePolicy/InsuranceLayerclasses are deprecated.)Exposure & Trends: Dynamically adjusts claim frequencies using actual financial state (via the
FinancialStateProviderprotocol) and applies trend multipliers over timeAnalysis Layer: Provides ergodic and optimization capabilities
Infrastructure: Manages computational efficiency and data handling
Validation: Ensures accuracy and robustness of results
Output: Delivers insights through visualizations and reports
2. Data Flow Architecture
Configuration and market data flow into the simulation engine
The
WidgetManufacturerinternally usesLedger,AccrualManager,InsuranceAccounting, andTaxHandlerfor precise financial trackingAll financial amounts use Python’s
Decimaltype (viadecimal_utils) to prevent floating-point drift across long simulationsThe
Ledgermaintains an O(1) current balance cache with pruning support for performanceSimulations generate trajectories processed by analysis modules
Infrastructure layers provide caching and parallelization
Results flow to visualization and reporting components
3. Key Interactions
The Simulation Engine orchestrates the time evolution of the business model
The Manufacturer Model interacts with the Insurance Program for claim processing and uses the Ledger for all balance sheet operations
AccrualManager tracks timing differences between cash movements and accounting recognition (wages, interest, taxes, insurance claims)
InsuranceAccounting handles premium amortization as a prepaid asset and tracks insurance claim recoveries
TaxHandler consolidates tax calculation, accrual, and payment logic, delegating accrual tracking to the AccrualManager
InsurancePricer supports market cycles (Soft / Normal / Hard) to generate realistic premiums for insurance programs
The Exposure System uses a
FinancialStateProviderprotocol so thatExposureBasesubclasses query live financial state from the manufacturer for state-driven claim generationTrend classes (in
trends.py) provide multiplicative adjustments to claim frequencies and severities over time, supporting linear, scenario-based, and stochastic trendsMonte Carlo Engine generates multiple scenarios for statistical analysis
Ergodic Analyzer compares time-average vs ensemble-average growth
Batch Processor and Parallel Executor enable high-performance computing
4. Financial Accounting Subsystem
The financial accounting subsystem was introduced to provide GAAP-compliant financial tracking within the simulation. This subsystem is internal to the WidgetManufacturer and consists of four tightly integrated components:
        flowchart LR
       MANU["WidgetManufacturer"] --> LEDGER["Ledger"]
       MANU --> ACCRUAL["AccrualManager"]
       MANU --> INSACCT["InsuranceAccounting"]
       MANU --> TAXH["TaxHandler"]

       TAXH --> ACCRUAL
       LEDGER --> DECUTIL["decimal_utils"]
       ACCRUAL --> DECUTIL
       INSACCT --> DECUTIL

       classDef manuClass fill:#fff3e0,stroke:#e65100,stroke-width:2px
       classDef finClass fill:#fff9c4,stroke:#f9a825,stroke-width:2px
       classDef utilClass fill:#e0f2f1,stroke:#004d40,stroke-width:2px

       class MANU manuClass
       class LEDGER,ACCRUAL,INSACCT,TAXH finClass
       class DECUTIL utilClass
Ledger: Event-sourcing double-entry ledger with a typed
AccountNameenum (preventing typo bugs),AccountTypeclassification, O(1) balance lookups via an internal cache, and support for pruning old transactionsAccrualManager: Tracks accrual items (wages, interest, taxes, insurance claims, revenue) with configurable payment schedules (immediate, quarterly, annual, custom)
InsuranceAccounting: Manages premium payments as prepaid assets with straight-line monthly amortization, and tracks insurance claim recoveries separately from claim liabilities
TaxHandler: Centralizes tax calculation and accrual management, explicitly designed to avoid circular dependencies in the tax flow; delegates accrual tracking to
AccrualManagerdecimal_utils: Foundation module providing
to_decimal(),quantize_currency(), and standard constants (ZERO,ONE,PENNY) used by all financial modules
5. Insurance Subsystem
The insurance subsystem provides two complementary paths for modeling coverage:
        flowchart TB
       subgraph Deprecated["Deprecated"]
           INSPOL["InsurancePolicy"]
           INSLAY["InsuranceLayer"]
           INSPOL --> INSLAY
       end

       subgraph Primary["Primary"]
           INSPROG["InsuranceProgram"]
           ENHLAY["EnhancedInsuranceLayer"]
           INSPROG --> ENHLAY
       end

       PRICER["InsurancePricer<br/>(Soft / Normal / Hard)"]
       PRICER --> INSPROG

       INSPOL -.->|deprecated, use| INSPROG

       classDef deprecatedClass fill:#ffcdd2,stroke:#b71c1c,stroke-width:2px
       classDef primaryClass fill:#fff3e0,stroke:#ef6c00,stroke-width:2px
       classDef pricerClass fill:#f3e5f5,stroke:#7b1fa2,stroke-width:2px

       class INSPOL,INSLAY deprecatedClass
       class INSPROG,ENHLAY primaryClass
       class PRICER pricerClass
Primary Path:
InsuranceProgram(ininsurance_program.py) usesEnhancedInsuranceLayerobjects for full-featured coverage modeling including reinstatements, aggregate limits, and market-cycle-aware pricingDeprecated:
InsurancePolicy(ininsurance.py) withInsuranceLayeris deprecated in favor ofInsuranceProgramInsurancePricer (in
insurance_pricing.py) supports threeMarketCyclestates –HARD(60% loss ratio),NORMAL(70%), andSOFT(80%)
6. Exposure & Trend System
The exposure and trend system models how insurance risks evolve dynamically during simulation:
        flowchart LR
       MANU["WidgetManufacturer<br/>(implements protocol)"] -.-> FSPROV["FinancialStateProvider<br/>(Protocol)"]
       FSPROV --> EXPBASE["ExposureBase<br/>(Dynamic Frequency)"]
       TRENDS["trends.py<br/>(Trend Multipliers)"] --> LOSSG["ManufacturingLossGenerator"]
       EXPBASE --> LOSSG

       classDef coreClass fill:#fff3e0,stroke:#e65100,stroke-width:2px
       classDef protoClass fill:#e1f5fe,stroke:#01579b,stroke-width:2px
       classDef trendClass fill:#f3e5f5,stroke:#6a1b9a,stroke-width:2px

       class MANU coreClass
       class FSPROV,EXPBASE protoClass
       class TRENDS,LOSSG trendClass
FinancialStateProvider: A
Protocol(inexposure_base.py) defining properties likecurrent_revenue,current_assets,current_equityand their base counterparts.WidgetManufacturerimplements this protocol.ExposureBase: Abstract base for exposure classes that query live financial state to compute frequency multipliers (e.g.,
RevenueExposurescales claim frequency based on actual revenue vs. base revenue)trends.py: Provides a hierarchy of trend classes (
TrendABC,LinearTrend,ScenarioTrend, and stochastic variants) that apply multiplicative adjustments to claim frequencies and severities over time, supporting both annual and sub-annual time steps with optional seeded reproducibility
7. External Dependencies
The system integrates with:
NumPy/SciPy for numerical computations
Pandas for data manipulation
Matplotlib/Plotly for visualizations
OpenPyXL for Excel reporting
Multiprocessing for parallel execution
Python’s
decimalmodule for precise financial arithmetic
Key highlights:
9 Major Subsystems: Configuration, Financial Core, Insurance, Simulation, Analytics, Optimization, Results, Validation, and External I/O
50+ Modules: Comprehensive coverage of all system components
Clear Data Flows: Shows how information moves between subsystems
External Integrations: YAML configs, CSV exports, Jupyter notebooks, and Sphinx documentation
Module Dependencies and Relationships
The module overview diagram provides a detailed view of how the 50+ Python modules interact with each other, showing import relationships and dependency hierarchies.
Module Overview and Dependencies
This diagram shows the detailed module structure and dependencies within the Ergodic Insurance framework.
graph LR
%% Configuration Layer
subgraph Config["Configuration Management"]
CONFIG_BASE["config.py<br/>Base Configuration"]
CONFIG_V2["config.py<br/>Config Models"]
CONFIG_MGR["config_manager.py<br/>Config Manager"]
CONFIG_LOADER["config_loader.py<br/>Config Loader"]
CONFIG_MIG["config_migrator.py<br/>Migration Tools"]
end
%% Core Business Logic
subgraph Business["Business Logic"]
MANUFACTURER["manufacturer.py<br/>ClaimLiability, TaxHandler,<br/>WidgetManufacturer"]
INSURANCE["insurance.py<br/>Insurance Policy"]
INS_PROGRAM["insurance_program.py<br/>Insurance Program"]
INS_PRICING["insurance_pricing.py<br/>Pricing Models"]
CLAIM_DEV["claim_development.py<br/>Claim Development"]
EXPOSURE["exposure_base.py<br/>Exposure Models &<br/>FinancialStateProvider Protocol"]
LEDGER["ledger.py<br/>Double-Entry Ledger"]
ACCRUAL["accrual_manager.py<br/>Accrual Accounting"]
INS_ACCT["insurance_accounting.py<br/>Insurance Accounting"]
DECIMAL_UTILS["decimal_utils.py<br/>Decimal Precision"]
TRENDS["trends.py<br/>Trend Analysis"]
end
%% Simulation Engine
subgraph Simulation["Simulation Core"]
SIM_CORE["simulation.py<br/>Main Engine"]
MONTE_CARLO["monte_carlo.py<br/>Monte Carlo"]
MONTE_WORKER["monte_carlo_worker.py<br/>MC Worker"]
STOCHASTIC["stochastic_processes.py<br/>Stochastic Models"]
LOSS_DIST["loss_distributions.py<br/>Loss Distributions"]
end
%% Analysis Tools
subgraph Analysis["Analysis & Optimization"]
ERGODIC_ANALYZER["ergodic_analyzer.py<br/>Ergodic Analysis"]
BUSINESS_OPT["business_optimizer.py<br/>Optimization"]
DECISION_ENGINE["decision_engine.py<br/>Decision Making"]
OPTIMIZATION["optimization.py<br/>Optimization Algos"]
HJB_SOLVER["hjb_solver.py<br/>HJB Equations"]
OPTIMAL_CTRL["optimal_control.py<br/>Control Theory"]
end
%% Validation & Testing
subgraph Validation["Validation"]
ACCURACY_VAL["accuracy_validator.py<br/>Accuracy Checks"]
STRATEGY_BACK["strategy_backtester.py<br/>Backtesting"]
WALK_FORWARD["walk_forward_validator.py<br/>Walk-Forward"]
VALIDATION_METRICS["validation_metrics.py<br/>Metrics"]
STATISTICAL_TESTS["statistical_tests.py<br/>Statistical Tests"]
end
%% Risk Analysis
subgraph Risk["Risk Analysis"]
RISK_METRICS["risk_metrics.py<br/>Risk Metrics"]
RUIN_PROB["ruin_probability.py<br/>Ruin Analysis"]
SENSITIVITY["sensitivity.py<br/>Sensitivity Analysis"]
SENS_VIZ["sensitivity_visualization.py<br/>Sensitivity Viz"]
PARETO["pareto_frontier.py<br/>Pareto Analysis"]
BOOTSTRAP["bootstrap_analysis.py<br/>Bootstrap Methods"]
end
%% Performance & Infrastructure
subgraph Infrastructure["Infrastructure"]
BATCH_PROC["batch_processor.py<br/>Batch Processing"]
PARALLEL_EXEC["parallel_executor.py<br/>Parallelization"]
PERF_OPT["performance_optimizer.py<br/>Performance"]
TRAJ_STORAGE["trajectory_storage.py<br/>Data Storage"]
PROGRESS_MON["progress_monitor.py<br/>Progress Tracking"]
PARAM_SWEEP["parameter_sweep.py<br/>Parameter Sweeps"]
end
%% Reporting & Visualization
subgraph Reporting["Reporting & Visualization"]
VIZ_LEGACY["visualization_legacy.py<br/>Legacy Plots"]
EXCEL_REPORT["excel_reporter.py<br/>Excel Reports"]
SUMMARY_STATS["summary_statistics.py<br/>Statistics"]
RESULT_AGG["result_aggregator.py<br/>Aggregation"]
FINANCIAL_STMT["financial_statements.py<br/>Statements"]
end
%% Visualization Submodule
subgraph VizModule["visualization/"]
VIZ_CORE["core.py<br/>Core Functions"]
VIZ_EXEC["executive_plots.py<br/>Executive Views"]
VIZ_TECH["technical_plots.py<br/>Technical Views"]
VIZ_ANNOT["annotations.py<br/>Annotations"]
VIZ_STYLE["style_manager.py<br/>Styling"]
VIZ_FACTORY["figure_factory.py<br/>Figure Factory"]
VIZ_EXPORT["export.py<br/>Export Tools"]
VIZ_BATCH["batch_plots.py<br/>Batch Plotting"]
VIZ_INTERACT["interactive_plots.py<br/>Interactive Plots"]
VIZ_TOWER["improved_tower_plot.py<br/>Tower Plots"]
end
%% Reporting Submodule
subgraph ReportModule["reporting/"]
REP_BUILDER["report_builder.py<br/>Report Builder"]
REP_EXEC["executive_report.py<br/>Executive Reports"]
REP_TECH["technical_report.py<br/>Technical Reports"]
REP_SCENARIO["scenario_comparator.py<br/>Scenario Compare"]
REP_TABLE["table_generator.py<br/>Table Generator"]
REP_INSIGHT["insight_extractor.py<br/>Insights"]
REP_FORMAT["formatters.py<br/>Formatters"]
REP_CACHE["cache_manager.py<br/>Cache Manager"]
REP_VALID["validator.py<br/>Report Validator"]
REP_CONFIG["config.py<br/>Report Config"]
end
%% Advanced Features
subgraph Advanced["Advanced Features"]
CONVERGENCE["convergence.py<br/>Convergence"]
CONV_ADV["convergence_advanced.py<br/>Advanced Conv."]
CONV_PLOTS["convergence_plots.py<br/>Conv. Plots"]
ADAPTIVE_STOP["adaptive_stopping.py<br/>Adaptive Stopping"]
SCENARIO_MGR["scenario_manager.py<br/>Scenarios"]
BENCHMARKING["benchmarking.py<br/>Benchmarks"]
end
%% Configuration dependencies
CONFIG_BASE --> MANUFACTURER
CONFIG_V2 --> CONFIG_MGR
CONFIG_MGR --> CONFIG_LOADER
CONFIG_LOADER --> CONFIG_MGR
%% Business Logic: Decimal utilities feed into accounting modules
DECIMAL_UTILS --> LEDGER
DECIMAL_UTILS --> ACCRUAL
DECIMAL_UTILS --> INS_ACCT
DECIMAL_UTILS --> MANUFACTURER
%% Business Logic: Accounting modules feed into manufacturer
LEDGER --> MANUFACTURER
ACCRUAL --> MANUFACTURER
INS_ACCT --> MANUFACTURER
%% Business Logic: Insurance and exposure relationships
INSURANCE --> INS_PROGRAM
INS_PRICING --> INS_PROGRAM
EXPOSURE --> MANUFACTURER
%% Simulation dependencies
MANUFACTURER --> SIM_CORE
INS_PROGRAM --> SIM_CORE
LOSS_DIST --> SIM_CORE
SIM_CORE --> MONTE_CARLO
MONTE_CARLO --> MONTE_WORKER
STOCHASTIC --> MONTE_CARLO
%% Analysis dependencies
MONTE_CARLO --> ERGODIC_ANALYZER
ERGODIC_ANALYZER --> BUSINESS_OPT
BUSINESS_OPT --> DECISION_ENGINE
%% Validation dependencies
MONTE_CARLO --> ACCURACY_VAL
STRATEGY_BACK --> WALK_FORWARD
%% Risk dependencies
ERGODIC_ANALYZER --> RISK_METRICS
RISK_METRICS --> RUIN_PROB
SENSITIVITY --> PARETO
SENSITIVITY --> SENS_VIZ
%% Infrastructure dependencies
BATCH_PROC --> PARALLEL_EXEC
PARALLEL_EXEC --> MONTE_CARLO
%% Reporting dependencies
RESULT_AGG --> SUMMARY_STATS
SUMMARY_STATS --> EXCEL_REPORT
FINANCIAL_STMT --> EXCEL_REPORT
%% Visualization dependencies
VIZ_CORE --> VIZ_FACTORY
VIZ_STYLE --> VIZ_EXEC
VIZ_STYLE --> VIZ_TECH
VIZ_FACTORY --> VIZ_EXPORT
VIZ_BATCH --> VIZ_CORE
VIZ_INTERACT --> VIZ_CORE
VIZ_TOWER --> VIZ_STYLE
%% Reporting module dependencies
REP_BUILDER --> REP_EXEC
REP_BUILDER --> REP_TECH
REP_SCENARIO --> REP_TABLE
REP_INSIGHT --> REP_EXEC
REP_FORMAT --> REP_TABLE
REP_CACHE --> REP_BUILDER
REP_VALID --> REP_BUILDER
%% Styling
classDef config fill:#e3f2fd,stroke:#1565c0,stroke-width:2px
classDef business fill:#fff9c4,stroke:#f57f17,stroke-width:2px
classDef simulation fill:#f3e5f5,stroke:#6a1b9a,stroke-width:2px
classDef analysis fill:#e8f5e9,stroke:#2e7d32,stroke-width:2px
classDef validation fill:#fce4ec,stroke:#c2185b,stroke-width:2px
classDef risk fill:#fff3e0,stroke:#ef6c00,stroke-width:2px
classDef infra fill:#e0f2f1,stroke:#00695c,stroke-width:2px
classDef reporting fill:#f1f8e9,stroke:#558b2f,stroke-width:2px
classDef viz fill:#e1f5fe,stroke:#0277bd,stroke-width:2px
classDef report fill:#fff8e1,stroke:#f9a825,stroke-width:2px
classDef advanced fill:#fafafa,stroke:#424242,stroke-width:2px
class CONFIG_BASE,CONFIG_V2,CONFIG_MGR,CONFIG_LOADER,CONFIG_MIG config
class MANUFACTURER,INSURANCE,INS_PROGRAM,INS_PRICING,CLAIM_DEV,EXPOSURE,LEDGER,ACCRUAL,INS_ACCT,DECIMAL_UTILS,TRENDS business
class SIM_CORE,MONTE_CARLO,MONTE_WORKER,STOCHASTIC,LOSS_DIST simulation
class ERGODIC_ANALYZER,BUSINESS_OPT,DECISION_ENGINE,OPTIMIZATION,HJB_SOLVER,OPTIMAL_CTRL analysis
class ACCURACY_VAL,STRATEGY_BACK,WALK_FORWARD,VALIDATION_METRICS,STATISTICAL_TESTS validation
class RISK_METRICS,RUIN_PROB,SENSITIVITY,SENS_VIZ,PARETO,BOOTSTRAP risk
class BATCH_PROC,PARALLEL_EXEC,PERF_OPT,TRAJ_STORAGE,PROGRESS_MON,PARAM_SWEEP infra
class VIZ_LEGACY,EXCEL_REPORT,SUMMARY_STATS,RESULT_AGG,FINANCIAL_STMT reporting
class VIZ_CORE,VIZ_EXEC,VIZ_TECH,VIZ_ANNOT,VIZ_STYLE,VIZ_FACTORY,VIZ_EXPORT,VIZ_BATCH,VIZ_INTERACT,VIZ_TOWER viz
class REP_BUILDER,REP_EXEC,REP_TECH,REP_SCENARIO,REP_TABLE,REP_INSIGHT,REP_FORMAT,REP_CACHE,REP_VALID,REP_CONFIG report
class CONVERGENCE,CONV_ADV,CONV_PLOTS,ADAPTIVE_STOP,SCENARIO_MGR,BENCHMARKING advanced
Module Categories
Configuration Management
Handles all configuration aspects including loading, validation, migration, and compatibility between different configuration versions.
Business Logic
Core business domain models including the manufacturer, insurance policies, pricing, claim processing, and financial accounting infrastructure.
ledger.py - Double-entry financial ledger implementing event-sourced transaction tracking. Provides
AccountType,AccountName,EntryType, andTransactionTypeenums along withLedgerEntryandLedgerclasses for GAAP-compliant accounting with full audit trails.accrual_manager.py - Accrual accounting management following GAAP timing principles. Contains
AccrualTypeandPaymentScheduleenums, plusAccrualItemandAccrualManagerclasses for tracking timing differences between cash movements and accounting recognition.insurance_accounting.py - Insurance premium accounting with prepaid asset tracking and systematic amortization. Provides
InsuranceRecoveryandInsuranceAccountingclasses for claim recovery receivables and premium expense management.decimal_utils.py - Decimal precision utilities for financial calculations. Provides
to_decimal,quantize_currency, and related helpers along with constants (ZERO,ONE,PENNY) to prevent floating-point accumulation errors in iterative simulations.trends.py - Trend analysis for insurance claim frequency and severity adjustments. Implements a hierarchy of trend classes (
Trend,NoTrend,LinearTrend,RandomWalkTrend,MeanRevertingTrend,RegimeSwitchingTrend,ScenarioTrend) that apply multiplicative adjustments over time.manufacturer.py - Core financial model containing
ClaimLiability(actuarial claim payment tracking),TaxHandler(tax computation logic), andWidgetManufacturer(main business simulation class).WidgetManufacturerintegrates withLedger,AccrualManager, andInsuranceAccountingfor full double-entry financial modeling.exposure_base.py - Exposure models and the
FinancialStateProviderprotocol. The protocol defines the interface for providing real-time financial state to exposure bases;WidgetManufacturerimplements this protocol.
Simulation Core
The main simulation engine that orchestrates time evolution, Monte Carlo runs, and stochastic processes.
Analysis & Optimization
Advanced analytical tools including ergodic analysis, business optimization, and decision-making engines.
Validation
Comprehensive validation framework for ensuring accuracy and robustness of simulations.
Risk Analysis
Specialized risk assessment tools including ruin probability, sensitivity analysis, and bootstrap methods.
Infrastructure
High-performance computing infrastructure for parallel processing, caching, and data management.
Reporting & Visualization
Output generation including Excel reports, visualizations, and statistical summaries.
Advanced Features
Sophisticated features for convergence monitoring, adaptive stopping, and benchmarking.
Module organization:
Core Financial (4 modules): Central business logic and financial modeling
Insurance & Risk (5 modules): Insurance structures and risk management
Simulation (5 modules): Monte Carlo engine and parallel execution
Analytics (10 modules): Statistical analysis and metrics calculation
Optimization (6 modules): Strategy optimization and control theory
Results (7 modules): Reporting and visualization
Validation (7 modules): Testing and performance validation
Configuration (6 modules): Parameter management and settings
Class Diagrams
Detailed class structures are organized into three main categories:
Core Classes
The core classes diagram shows the fundamental building blocks of the system, including financial models, insurance structures, and simulation components.
Core Classes Diagram
This diagram shows the main classes and their relationships in the core simulation engine. The diagrams are split into focused views for readability: an overview diagram showing high-level relationships, followed by detailed diagrams for the business model, insurance, loss generation, and simulation subsystems.
Overview Diagram
        classDiagram
    direction TB

    class Simulation {
        +manufacturer: WidgetManufacturer
        +loss_generator: List~ManufacturingLossGenerator~
        +insurance_program: InsuranceProgram
        +time_horizon: int
        +run() SimulationResults
        +step_annual(year, losses) dict
        +run_with_loss_data() SimulationResults
        +get_trajectory() DataFrame
    }

    class _compare_strategies {
        <<module>>
        +run_monte_carlo(config, policy, n_scenarios) dict
        +compare_strategies(config, policies, n_scenarios) StrategyComparisonResult
    }

    class MonteCarloEngine {
        +loss_generator: ManufacturingLossGenerator
        +insurance_program: InsuranceProgram
        +manufacturer: WidgetManufacturer
        +config: MonteCarloConfig
        +run() MonteCarloResults
        +export_results(results, filepath)
        +compute_bootstrap_confidence_intervals() dict
        +run_with_progress_monitoring() MonteCarloResults
        +run_with_convergence_monitoring() MonteCarloResults
        +estimate_ruin_probability() RuinProbabilityResults
    }

    class WidgetManufacturer {
        +config: ManufacturerConfig
        +ledger: Ledger
        +insurance_accounting: InsuranceAccounting
        +accrual_manager: AccrualManager
        +step() MetricsDict
        +calculate_revenue() Decimal
        +process_insurance_claim() tuple
        +check_solvency() bool
        +copy() WidgetManufacturer
        +reset()
    }

    class InsuranceProgram {
        +layers: List~EnhancedInsuranceLayer~
        +deductible: float
        +layer_states: List~LayerState~
        +calculate_premium() float
        +process_claim(amount) dict
        +calculate_ergodic_benefit() dict
        +optimize_layer_structure() OptimalStructure
    }

    class InsurancePolicy {
        <<deprecated>>
        +layers: List~InsuranceLayer~
        +deductible: float
        +process_claim(amount) tuple
        +calculate_premium() float
        +to_enhanced_program() InsuranceProgram
    }

    class ManufacturingLossGenerator {
        +attritional: AttritionalLossGenerator
        +large: LargeLossGenerator
        +catastrophic: CatastrophicLossGenerator
        +generate_losses(duration, revenue) tuple
        +reseed(seed)
        +validate_distributions() dict
    }

    Simulation --> WidgetManufacturer : simulates
    Simulation --> ManufacturingLossGenerator : uses
    Simulation --> InsurancePolicy : uses (deprecated)
    Simulation --> SimulationResults : produces

    MonteCarloEngine --> WidgetManufacturer : copies per path
    MonteCarloEngine --> ManufacturingLossGenerator : uses
    MonteCarloEngine --> InsuranceProgram : uses
    MonteCarloEngine --> MonteCarloResults : produces

    _compare_strategies --> MonteCarloEngine : orchestrates MC runs

    InsurancePolicy --> InsuranceProgram : converts to (deprecated)

    WidgetManufacturer ..|> FinancialStateProvider : implements
Business Model Detail
This diagram shows the internal structure of the manufacturer model, including the financial ledger, tax handling, claim liabilities, and accounting modules.
        classDiagram
    class WidgetManufacturer {
        +config: ManufacturerConfig
        +ledger: Ledger
        +insurance_accounting: InsuranceAccounting
        +accrual_manager: AccrualManager
        +stochastic_process: StochasticProcess
        +claim_liabilities: List~ClaimLiability~
        +is_ruined: bool
        +cash: Decimal
        +accounts_receivable: Decimal
        +inventory: Decimal
        +total_assets: Decimal
        +equity: Decimal
        +step() MetricsDict
        +calculate_revenue() Decimal
        +calculate_operating_income() Decimal
        +calculate_net_income() Decimal
        +process_insurance_claim() tuple
        +process_uninsured_claim() tuple
        +record_insurance_premium(amount)
        +record_insurance_loss(amount)
        +check_solvency() bool
        +handle_insolvency()
        +calculate_metrics() MetricsDict
        +copy() WidgetManufacturer
        +reset()
    }

    class ClaimLiability {
        +original_amount: Decimal
        +remaining_amount: Decimal
        +year_incurred: int
        +is_insured: bool
        +development_strategy: ClaimDevelopment
        +payment_schedule: List~float~
        +get_payment(years_since_incurred) Decimal
        +make_payment(amount) Decimal
    }

    class TaxHandler {
        +tax_rate: float
        +accrual_manager: AccrualManager
        +calculate_tax_liability(income) Decimal
        +apply_limited_liability_cap(tax, equity) tuple
        +calculate_and_accrue_tax() tuple
    }

    class ClaimDevelopment {
        +pattern_name: str
        +development_factors: List~float~
        +tail_factor: float
        +calculate_payments(amount, accident_yr, payment_yr) float
        +get_cumulative_paid(years_since_accident) float
        +create_immediate()$ ClaimDevelopment
        +create_medium_tail_5yr()$ ClaimDevelopment
        +create_long_tail_10yr()$ ClaimDevelopment
        +create_very_long_tail_15yr()$ ClaimDevelopment
    }

    class Ledger {
        <<Single Source of Truth>>
        +record_transaction()
        +get_balance(account) Decimal
        +prune_entries(before_date)
    }

    class AccrualManager {
        +record_accrual()
        +process_accrued_payments()
        +get_total_accruals() Decimal
    }

    class InsuranceAccounting {
        +record_premium()
        +record_loss()
        +record_recovery()
    }

    class FinancialStateProvider {
        <<Protocol>>
        +current_revenue: Decimal
        +current_assets: Decimal
        +current_equity: Decimal
        +base_revenue: Decimal
        +base_assets: Decimal
        +base_equity: Decimal
    }

    WidgetManufacturer --> Ledger : owns
    WidgetManufacturer --> AccrualManager : owns
    WidgetManufacturer --> InsuranceAccounting : owns
    WidgetManufacturer --> ClaimLiability : manages 0..*
    WidgetManufacturer --> TaxHandler : uses
    WidgetManufacturer ..|> FinancialStateProvider : implements

    ClaimLiability --> ClaimDevelopment : uses strategy
    TaxHandler --> AccrualManager : records accruals
Insurance Subsystem Detail
This diagram shows the primary insurance path (InsuranceProgram / EnhancedInsuranceLayer / LayerState)
and the deprecated basic path (InsurancePolicy / InsuranceLayer).
        classDiagram
    class InsurancePolicy {
        <<deprecated>>
        +layers: List~InsuranceLayer~
        +deductible: float
        +pricing_enabled: bool
        +pricer: InsurancePricer
        +process_claim(amount) tuple
        +calculate_recovery(amount) float
        +calculate_premium() float
        +get_total_coverage() float
        +from_yaml(path)$ InsurancePolicy
        +to_enhanced_program() InsuranceProgram
        +apply_pricing(revenue)
        +create_with_pricing()$ InsurancePolicy
    }

    class InsuranceLayer {
        <<deprecated, dataclass>>
        +attachment_point: float
        +limit: float
        +rate: float
        +calculate_recovery(loss_amount) float
        +calculate_premium() float
    }

    class InsuranceProgram {
        +name: str
        +layers: List~EnhancedInsuranceLayer~
        +deductible: float
        +layer_states: List~LayerState~
        +pricing_enabled: bool
        +pricer: InsurancePricer
        +calculate_premium() float
        +process_claim(amount) dict
        +process_annual_claims(claims) dict
        +reset_annual()
        +get_program_summary() dict
        +get_total_coverage() float
        +calculate_ergodic_benefit(loss_history) dict
        +find_optimal_attachment_points(data) list
        +optimize_layer_widths(points, budget) list
        +optimize_layer_structure(loss_data) OptimalStructure
        +from_yaml(path)$ InsuranceProgram
        +create_standard_manufacturing_program()$ InsuranceProgram
        +apply_pricing(revenue)
        +create_with_pricing()$ InsuranceProgram
        +get_pricing_summary() dict
    }

    class EnhancedInsuranceLayer {
        <<dataclass>>
        +attachment_point: float
        +limit: float
        +base_premium_rate: float
        +reinstatements: int
        +reinstatement_premium: float
        +reinstatement_type: ReinstatementType
        +aggregate_limit: float
        +limit_type: str
        +calculate_base_premium() float
        +calculate_reinstatement_premium() float
        +can_respond(loss_amount) bool
        +calculate_layer_loss(total_loss) float
    }

    class LayerState {
        <<dataclass>>
        +layer: EnhancedInsuranceLayer
        +current_limit: float
        +used_limit: float
        +is_exhausted: bool
        +aggregate_used: float
        +process_claim(amount, timing) tuple
        +reset()
        +get_available_limit() float
        +get_utilization_rate() float
    }

    InsurancePolicy --> InsuranceLayer : contains 1..* (deprecated)
    InsurancePolicy ..> InsuranceProgram : converts to (deprecated)

    InsuranceProgram --> EnhancedInsuranceLayer : contains 1..*
    InsuranceProgram --> LayerState : tracks 1..*

    LayerState --> EnhancedInsuranceLayer : wraps
Loss Generation Subsystem
This diagram shows the composite loss generator pattern and the loss event model.
ManufacturingLossGenerator composes three specialized generators for different
severity bands: attritional, large, and catastrophic.
        classDiagram
    class ManufacturingLossGenerator {
        +attritional: AttritionalLossGenerator
        +large: LargeLossGenerator
        +catastrophic: CatastrophicLossGenerator
        +exposure: ExposureBase
        +gpd_generator: GeneralizedParetoLoss
        +generate_losses(duration, revenue) tuple
        +reseed(seed)
        +create_simple(freq, mean, std)$ ManufacturingLossGenerator
        +validate_distributions() dict
    }

    class AttritionalLossGenerator {
        +frequency: float
        +severity: LognormalLoss
        +generate_losses(duration, revenue) list
        +reseed(seed)
    }

    class LargeLossGenerator {
        +frequency: float
        +severity: LognormalLoss
        +generate_losses(duration, revenue) list
        +reseed(seed)
    }

    class CatastrophicLossGenerator {
        +frequency: float
        +severity: ParetoLoss
        +generate_losses(duration, revenue) list
        +reseed(seed)
    }

    class LossEvent {
        <<dataclass>>
        +amount: float
        +time: float
        +loss_type: str
        +description: str
    }

    class LossDistribution {
        <<abstract>>
        +rng: Generator
        +generate_severity(n)* ndarray
        +expected_value()* float
        +reset_seed(seed)
    }

    class LognormalLoss {
        +mu: float
        +sigma: float
        +mean: float
        +generate_severity(n) ndarray
        +expected_value() float
    }

    class ParetoLoss {
        +alpha: float
        +xm: float
        +generate_severity(n) ndarray
        +expected_value() float
    }

    ManufacturingLossGenerator *-- AttritionalLossGenerator : composes
    ManufacturingLossGenerator *-- LargeLossGenerator : composes
    ManufacturingLossGenerator *-- CatastrophicLossGenerator : composes
    ManufacturingLossGenerator ..> LossEvent : produces

    AttritionalLossGenerator ..> LossEvent : produces
    LargeLossGenerator ..> LossEvent : produces
    CatastrophicLossGenerator ..> LossEvent : produces

    LognormalLoss --|> LossDistribution
    ParetoLoss --|> LossDistribution

    AttritionalLossGenerator --> LognormalLoss : uses
    LargeLossGenerator --> LognormalLoss : uses
    CatastrophicLossGenerator --> ParetoLoss : uses
Simulation and Monte Carlo Detail
This diagram shows the simulation orchestration layer, including both the
single-path Simulation class and the multi-path MonteCarloEngine.
        classDiagram
    class Simulation {
        +manufacturer: WidgetManufacturer
        +loss_generator: List~ManufacturingLossGenerator~
        +insurance_program: InsuranceProgram
        +time_horizon: int
        +seed: int
        +run(progress_interval) SimulationResults
        +step_annual(year, losses) dict
        +run_with_loss_data(loss_data) SimulationResults
        +get_trajectory() DataFrame
    }

    class _compare_strategies {
        <<module>>
        +run_monte_carlo(config, policy, n_scenarios) dict
        +compare_strategies(config, policies, n_scenarios) StrategyComparisonResult
    }

    class SimulationResults {
        <<dataclass>>
        +years: ndarray
        +assets: ndarray
        +equity: ndarray
        +roe: ndarray
        +revenue: ndarray
        +net_income: ndarray
        +claim_counts: ndarray
        +claim_amounts: ndarray
        +insolvency_year: int
        +to_dataframe() DataFrame
        +calculate_time_weighted_roe() float
        +calculate_rolling_roe(window) ndarray
        +summary_stats() dict
    }

    class MonteCarloEngine {
        +loss_generator: ManufacturingLossGenerator
        +insurance_program: InsuranceProgram
        +manufacturer: WidgetManufacturer
        +config: MonteCarloConfig
        +convergence_diagnostics: ConvergenceDiagnostics
        +parallel_executor: ParallelExecutor
        +trajectory_storage: TrajectoryStorage
        +run() MonteCarloResults
        -_run_sequential() MonteCarloResults
        -_run_parallel() MonteCarloResults
        -_run_enhanced_parallel() MonteCarloResults
        -_calculate_growth_rates(assets) ndarray
        -_calculate_metrics(results) dict
        -_check_convergence(results) dict
        +export_results(results, filepath)
        +compute_bootstrap_confidence_intervals(results) dict
        +run_with_progress_monitoring() MonteCarloResults
        +run_with_convergence_monitoring() MonteCarloResults
        +estimate_ruin_probability(config) RuinProbabilityResults
    }

    class MonteCarloResults {
        <<dataclass>>
        +final_assets: ndarray
        +annual_losses: ndarray
        +insurance_recoveries: ndarray
        +retained_losses: ndarray
        +growth_rates: ndarray
        +ruin_probability: dict
        +metrics: dict
        +convergence: dict
        +execution_time: float
        +config: MonteCarloConfig
        +performance_metrics: PerformanceMetrics
        +bootstrap_confidence_intervals: dict
        +summary() str
    }

    class MonteCarloConfig {
        <<dataclass>>
        +n_simulations: int
        +n_years: int
        +parallel: bool
        +n_workers: int
        +seed: int
        +use_enhanced_parallel: bool
        +insolvency_tolerance: float
    }

    Simulation --> SimulationResults : produces
    MonteCarloEngine --> MonteCarloResults : produces
    MonteCarloEngine --> MonteCarloConfig : configured by
    _compare_strategies --> MonteCarloEngine : orchestrates MC runs
Class Interactions
        sequenceDiagram
    participant MC as MonteCarloEngine
    participant S as Simulation
    participant M as WidgetManufacturer
    participant LG as ManufacturingLossGenerator
    participant IP as InsuranceProgram
    participant SR as SimulationResults

    MC->>M: copy() for each path
    MC->>LG: reseed() per path

    rect rgb(240, 240, 255)
    Note over S,SR: Single Simulation Path
    loop Each Year
        S->>LG: generate_losses(duration, revenue)
        LG-->>S: List of LossEvent

        loop Each LossEvent
            S->>IP: process_claim(amount)
            IP-->>S: recovery details dict
            S->>M: record_insurance_loss(retained)
            S->>M: record_insurance_premium(premium)
        end

        S->>M: step(growth_rate)
        M->>M: calculate_revenue()
        M->>M: calculate_operating_income()
        M->>M: calculate_net_income()
        M->>M: check_solvency()
        M-->>S: MetricsDict

        alt Insolvent
            M->>M: handle_insolvency()
            S-->>MC: Early termination
        end
    end

    S->>SR: Compile results
    end

    SR-->>MC: Path results
    MC->>MC: Aggregate all paths
    MC->>MC: Calculate risk metrics
    MC->>MC: Check convergence
Key Design Patterns
1. Strategy Pattern
ClaimLiabilityusesClaimDevelopmentas a payment strategyInsurance structures can use different pricing engines (
InsurancePricer)Loss generators use pluggable severity distributions (
LossDistribution)
2. Composite Pattern
ManufacturingLossGeneratorcomposesAttritionalLossGenerator,LargeLossGenerator, andCatastrophicLossGeneratorInsuranceProgrammanages multipleEnhancedInsuranceLayerinstances
3. Protocol (Structural Typing)
FinancialStateProviderprotocol enables exposure-based classes to query live financial state fromWidgetManufacturerwithout tight couplingImplemented via Python
typing.Protocolfor duck-typed structural subtyping
4. Factory Pattern
ManufacturingLossGenerator.create_simple()for easy setupInsuranceProgram.create_standard_manufacturing_program()for standard configurationsClaimDevelopment.create_immediate(),create_medium_tail_5yr(), etc. for preset patternsInsurancePolicy.create_with_pricing()andInsuranceProgram.create_with_pricing()for priced programs
5. Event Sourcing
Ledgerserves as the single source of truth for all balance sheet accountsAll financial mutations go through ledger transactions
Balance sheet values are derived from ledger state, not stored independently
6. Observer Pattern
ProgressMonitorobserves Monte Carlo simulation progressConvergenceDiagnosticsmonitors chain convergence during execution
7. Facade Pattern
MonteCarloEngineprovides a simplified interface to complex parallel execution, checkpointing, and aggregationInsuranceProgramfacades complex multi-layer claim allocation with reinstatements
Key components:
WidgetManufacturer: Central financial model with balance sheet evolution
StochasticProcess: Abstract base for various volatility models (GBM, OU, Lognormal)
InsuranceProgram: Multi-layer insurance structure implementation
ClaimGenerator: Loss event generation with configurable distributions
Data Models
The data models diagram illustrates configuration structures, result objects, and data transfer objects used throughout the system.
Data Models and Analysis Classes
This document shows the data structures and analysis models used throughout the system. The diagrams are split into focused sections for readability.
Ergodic Analysis
The ergodic analysis subsystem implements Ole Peters’ ergodic economics framework, comparing time-average versus ensemble-average growth rates to demonstrate how insurance transforms business growth dynamics.
        classDiagram
    class ErgodicAnalyzer {
        -convergence_threshold: float
        +calculate_time_average_growth(trajectories) dict
        +calculate_ensemble_average(trajectories) dict
        +compare_scenarios(insured, uninsured, metric) dict
        +check_convergence(values, window_size) tuple
        +analyze_simulation_batch(results, label) dict
        +integrate_loss_ergodic_analysis(loss_data, insurance, manufacturer) ErgodicAnalysisResults
        +validate_insurance_ergodic_impact(...) ValidationResults
        +significance_test(insured_growth, uninsured_growth) dict
    }

    class ErgodicData {
        <<dataclass>>
        +time_series: ndarray
        +values: ndarray
        +metadata: dict
        +validate() bool
    }

    class ErgodicAnalysisResults {
        <<dataclass>>
        +time_average_growth: float
        +ensemble_average_growth: float
        +survival_rate: float
        +ergodic_divergence: float
        +insurance_impact: dict
        +validation_passed: bool
        +metadata: dict
    }

    class ValidationResults {
        <<dataclass>>
        +is_valid: bool
        +checks: dict
        +warnings: list
        +summary: str
    }

    ErgodicAnalyzer --> ErgodicData : accepts
    ErgodicAnalyzer --> ErgodicAnalysisResults : produces
    ErgodicAnalyzer --> ValidationResults : validates with
    ErgodicAnalysisResults --> ErgodicData : derived from
ErgodicAnalyzer is the core analysis engine. It accepts trajectories as ErgodicData or SimulationResults, calculates time-average and ensemble-average growth rates, performs convergence checks, and runs integrated loss-ergodic analysis. The compare_scenarios() method is the primary entry point for comparing insured versus uninsured outcomes.
ErgodicData is a lightweight dataclass holding time series arrays and metadata. It validates array length consistency before analysis.
ErgodicAnalysisResults captures the complete output of an integrated analysis, including growth rates, survival statistics, insurance impact metrics, and validation status.
Business Optimization
The optimization subsystem uses ergodic metrics to find insurance strategies that maximize real business outcomes such as ROE, growth rate, and survival probability.
        classDiagram
    class BusinessOptimizer {
        -manufacturer: WidgetManufacturer
        -loss_distribution: LossDistribution
        -decision_engine: InsuranceDecisionEngine
        -ergodic_analyzer: ErgodicAnalyzer
        -optimizer_config: BusinessOptimizerConfig
        +maximize_roe_with_insurance(constraints, time_horizon) OptimalStrategy
        +minimize_bankruptcy_risk(growth_targets, budget) OptimalStrategy
        +optimize_capital_efficiency(constraints) OptimalStrategy
        +optimize_business_outcomes(objectives, constraints) BusinessOptimizationResult
    }

    class OptimalStrategy {
        <<dataclass>>
        +coverage_limit: float
        +deductible: float
        +premium_rate: float
        +expected_roe: float
        +bankruptcy_risk: float
        +growth_rate: float
        +capital_efficiency: float
        +recommendations: list~str~
        +to_dict() dict
    }

    class BusinessObjective {
        <<dataclass>>
        +name: str
        +weight: float
        +target_value: float
        +optimization_direction: OptimizationDirection
        +constraint_type: str
        +constraint_value: float
    }

    class BusinessConstraints {
        <<dataclass>>
        +max_risk_tolerance: float
        +min_roe_threshold: float
        +max_leverage_ratio: float
        +min_liquidity_ratio: float
        +max_premium_budget: float
        +min_coverage_ratio: float
        +regulatory_requirements: dict
    }

    class BusinessOptimizationResult {
        <<dataclass>>
        +optimal_strategy: OptimalStrategy
        +objective_values: dict
        +constraint_satisfaction: dict
        +convergence_info: dict
        +sensitivity_analysis: dict
        +is_feasible() bool
    }

    BusinessOptimizer --> OptimalStrategy : finds
    BusinessOptimizer --> BusinessObjective : uses
    BusinessOptimizer --> BusinessConstraints : respects
    BusinessOptimizer --> BusinessOptimizationResult : produces
    BusinessOptimizationResult --> OptimalStrategy : contains
BusinessOptimizer provides multiple optimization methods: maximize_roe_with_insurance() for ROE-focused optimization, minimize_bankruptcy_risk() for safety-first strategies, optimize_capital_efficiency() for capital allocation, and optimize_business_outcomes() for multi-objective optimization using BusinessObjective definitions.
OptimalStrategy is the output dataclass capturing the recommended insurance parameters (coverage limit, deductible, premium rate) along with expected business outcomes and actionable recommendations.
Risk Analysis
Risk metrics and ruin probability analysis provide the quantitative foundation for evaluating tail risk and insurance value.
        classDiagram
    class RiskMetrics {
        -losses: ndarray
        -weights: ndarray
        -rng: Generator
        +var(confidence, method, bootstrap_ci) float
        +tvar(confidence) float
        +expected_shortfall(confidence) float
        +pml(return_period) float
        +maximum_drawdown() float
        +economic_capital(confidence) float
        +tail_index(threshold) float
        +risk_adjusted_metrics() dict
        +coherence_test() dict
        +summary_statistics() dict
        +plot_distribution()
    }

    class RiskMetricsResult {
        <<dataclass>>
        +metric_name: str
        +value: float
        +confidence_level: float
        +confidence_interval: tuple
        +metadata: dict
    }

    class RuinProbabilityAnalyzer {
        -manufacturer: WidgetManufacturer
        -loss_generator: ManufacturingLossGenerator
        -insurance_program: InsuranceProgram
        -config: MonteCarloConfig
        +analyze_ruin_probability(config) RuinProbabilityResults
    }

    class RuinProbabilityResults {
        <<dataclass>>
        +time_horizons: ndarray
        +ruin_probabilities: ndarray
        +confidence_intervals: ndarray
        +bankruptcy_causes: dict
        +survival_curves: ndarray
        +execution_time: float
        +n_simulations: int
        +convergence_achieved: bool
        +mid_year_ruin_count: int
        +ruin_month_distribution: dict
        +summary() str
    }

    class RuinProbabilityConfig {
        <<dataclass>>
        +time_horizons: list~int~
        +n_simulations: int
        +min_assets_threshold: float
        +min_equity_threshold: float
        +early_stopping: bool
        +parallel: bool
        +n_workers: int
        +seed: int
        +n_bootstrap: int
    }

    RiskMetrics --> RiskMetricsResult : returns
    RuinProbabilityAnalyzer --> RuinProbabilityResults : produces
    RuinProbabilityAnalyzer --> RuinProbabilityConfig : configured by
RiskMetrics is initialized with a loss array and provides VaR, TVaR (CVaR), Expected Shortfall, PML, Maximum Drawdown, and other tail-risk measures. It supports both empirical and parametric methods with optional bootstrap confidence intervals.
RuinProbabilityAnalyzer runs Monte Carlo ruin analysis across multiple time horizons, with support for parallel execution, bootstrap confidence intervals, and mid-year ruin tracking.
Convergence Diagnostics
Convergence analysis ensures Monte Carlo simulations have run long enough to produce reliable results.
        classDiagram
    class ConvergenceDiagnostics {
        -r_hat_threshold: float
        -min_ess: int
        -relative_mcse_threshold: float
        +calculate_r_hat(chains) float
        +calculate_ess(chain, max_lag) float
        +calculate_batch_ess(chains, method) float
        +calculate_ess_per_second(chain, time) float
        +calculate_mcse(chain, ess) float
        +check_convergence(chains, metric_names) dict
        +geweke_test(chain) tuple
        +heidelberger_welch_test(chain, alpha) dict
    }

    class ConvergenceStats {
        <<dataclass>>
        +r_hat: float
        +ess: float
        +mcse: float
        +converged: bool
        +n_iterations: int
        +autocorrelation: float
    }

    ConvergenceDiagnostics --> ConvergenceStats : produces
ConvergenceDiagnostics implements Gelman-Rubin R-hat, Effective Sample Size (ESS), Monte Carlo Standard Error (MCSE), Geweke test, and Heidelberger-Welch stationarity test. The check_convergence() method returns a ConvergenceStats dataclass for each metric being tracked.
Loss Modeling
The loss modeling subsystem uses a composite pattern to combine attritional, large, and catastrophic loss generators into a unified manufacturing risk model.
        classDiagram
    class LossDistribution {
        <<abstract>>
        #rng: Generator
        +generate_severity(n_samples)* ndarray
        +expected_value()* float
        +reset_seed(seed) void
    }

    class LognormalLoss {
        +mean: float
        +cv: float
        +mu: float
        +sigma: float
        +generate_severity(n_samples) ndarray
        +expected_value() float
    }

    class ParetoLoss {
        +alpha: float
        +xm: float
        +generate_severity(n_samples) ndarray
        +expected_value() float
    }

    class GeneralizedParetoLoss {
        +severity_shape: float
        +severity_scale: float
        +generate_severity(n_samples) ndarray
        +expected_value() float
    }

    class LossEvent {
        <<dataclass>>
        +amount: float
        +time: float
        +loss_type: str
        +description: str
    }

    class LossData {
        <<dataclass>>
        +timestamps: ndarray
        +loss_amounts: ndarray
        +loss_types: list~str~
        +claim_ids: list~str~
        +development_factors: ndarray
        +metadata: dict
        +validate() bool
        +to_ergodic_format() ErgodicData
        +apply_insurance(program) LossData
        +from_loss_events(events)$ LossData
        +to_loss_events() list~LossEvent~
        +get_annual_aggregates(years) dict
        +calculate_statistics() dict
    }

    LossDistribution <|-- LognormalLoss
    LossDistribution <|-- ParetoLoss
    LossDistribution <|-- GeneralizedParetoLoss
    LossData --> LossEvent : converts to/from
LossDistribution is the abstract base class defining the interface for severity distributions. The three concrete implementations (Lognormal, Pareto, Generalized Pareto) cover the full spectrum from attritional to extreme tail modeling.
LossEvent is a lightweight dataclass representing a single loss occurrence with timing, amount, and type classification. LossData is the unified data container for cross-module compatibility, providing conversion to ergodic format and insurance application methods.
Loss Generation (Composite Pattern)
The manufacturing loss generator uses the Composite pattern to combine multiple loss layer generators, each with independent frequency and severity models.
        classDiagram
    class ManufacturingLossGenerator {
        +attritional: AttritionalLossGenerator
        +large: LargeLossGenerator
        +catastrophic: CatastrophicLossGenerator
        +gpd_generator: GeneralizedParetoLoss
        +threshold_value: float
        +exposure: ExposureBase
        +generate_losses(duration, revenue) tuple
        +reseed(seed) void
        +create_simple(frequency, severity_mean, severity_std, seed)$ ManufacturingLossGenerator
        +validate_distributions(n_simulations) dict
    }

    class AttritionalLossGenerator {
        +frequency_generator: FrequencyGenerator
        +severity_distribution: LognormalLoss
        +loss_type: str
        +generate_losses(duration, revenue) list~LossEvent~
        +reseed(seed) void
    }

    class LargeLossGenerator {
        +frequency_generator: FrequencyGenerator
        +severity_distribution: LognormalLoss
        +loss_type: str
        +generate_losses(duration, revenue) list~LossEvent~
        +reseed(seed) void
    }

    class CatastrophicLossGenerator {
        +frequency_generator: FrequencyGenerator
        +severity_distribution: ParetoLoss
        +loss_type: str
        +generate_losses(duration, revenue) list~LossEvent~
        +reseed(seed) void
    }

    class FrequencyGenerator {
        +base_frequency: float
        +revenue_scaling_exponent: float
        +reference_revenue: float
        -rng: Generator
        +reseed(seed) void
        +get_scaled_frequency(revenue) float
        +generate_event_times(duration, revenue) ndarray
    }

    ManufacturingLossGenerator *-- AttritionalLossGenerator : composes
    ManufacturingLossGenerator *-- LargeLossGenerator : composes
    ManufacturingLossGenerator *-- CatastrophicLossGenerator : composes
    ManufacturingLossGenerator o-- GeneralizedParetoLoss : optional extreme
    AttritionalLossGenerator --> FrequencyGenerator : uses
    LargeLossGenerator --> FrequencyGenerator : uses
    CatastrophicLossGenerator --> FrequencyGenerator : uses
    AttritionalLossGenerator --> LognormalLoss : severity
    LargeLossGenerator --> LognormalLoss : severity
    CatastrophicLossGenerator --> ParetoLoss : severity
ManufacturingLossGenerator is the composite orchestrator that combines three loss layers (attritional, large, catastrophic) with optional GPD extreme value transformation. The create_simple() class method provides a migration-friendly factory for basic use cases. Each sub-generator pairs a FrequencyGenerator (Poisson process with revenue scaling) with a LossDistribution for severities.
Sensitivity Analysis
Sensitivity tools analyze how parameter changes affect optimization outcomes, with built-in caching for computational efficiency.
        classDiagram
    class SensitivityAnalyzer {
        -base_config: dict
        -optimizer: Any
        -results_cache: dict
        -cache_dir: Path
        +analyze_parameter(param_name, param_range, n_points) SensitivityResult
        +create_tornado_diagram(parameters, metric) dict
        +analyze_parameter_group(params, metric) dict
    }

    class SensitivityResult {
        <<dataclass>>
        +parameter: str
        +baseline_value: float
        +variations: ndarray
        +metrics: dict
        +parameter_path: str
        +units: str
        +calculate_impact(metric) float
        +get_metric_bounds(metric) tuple
        +to_dataframe() DataFrame
    }

    class TwoWaySensitivityResult {
        <<dataclass>>
        +parameter1: str
        +parameter2: str
        +values1: ndarray
        +values2: ndarray
        +metric_grid: ndarray
        +metric_name: str
        +find_optimal_region(target, tolerance) ndarray
        +to_dataframe() DataFrame
    }

    SensitivityAnalyzer --> SensitivityResult : produces
    SensitivityAnalyzer --> TwoWaySensitivityResult : produces
SensitivityAnalyzer provides one-way parameter analysis, tornado diagram generation, and parameter group analysis. It uses MD5-based caching to avoid redundant optimizer runs. Results are captured as SensitivityResult (one-way) or TwoWaySensitivityResult (two-way interaction) dataclasses with built-in DataFrame conversion.
Financial Statements
The financial statement subsystem generates GAAP-compliant Balance Sheet, Income Statement, and Cash Flow Statement from simulation data, with support for both indirect and direct (ledger-based) cash flow methods.
        classDiagram
    class FinancialStatementGenerator {
        -manufacturer: WidgetManufacturer
        -manufacturer_data: dict
        -config: FinancialStatementConfig
        -metrics_history: list
        -years_available: int
        -ledger: Ledger
        +generate_balance_sheet(year) DataFrame
        +generate_income_statement(year) DataFrame
        +generate_cash_flow_statement(year) DataFrame
        +generate_reconciliation_report(year) DataFrame
    }

    class CashFlowStatement {
        -metrics_history: list
        -config: Any
        -ledger: Ledger
        +generate_statement(year, period, method) DataFrame
    }

    class FinancialStatementConfig {
        <<dataclass>>
        +currency_symbol: str
        +decimal_places: int
        +include_yoy_change: bool
        +include_percentages: bool
        +fiscal_year_end: int
        +consolidate_monthly: bool
    }

    FinancialStatementGenerator --> CashFlowStatement : delegates to
    FinancialStatementGenerator --> FinancialStatementConfig : configured by
    FinancialStatementGenerator ..> WidgetManufacturer : reads from
FinancialStatementGenerator is the primary entry point, accepting a WidgetManufacturer (or raw data dictionary) and generating formatted DataFrames for each financial statement. It supports ledger-based direct method cash flow when a Ledger is available. The generate_reconciliation_report() method validates the accounting equation and solvency checks.
CashFlowStatement handles the three-section cash flow statement (Operating, Investing, Financing) with both indirect and direct method support.
Data Flow Sequence
        sequenceDiagram
    participant LG as ManufacturingLossGenerator
    participant Sim as Simulation
    participant EA as ErgodicAnalyzer
    participant BO as BusinessOptimizer
    participant SA as SensitivityAnalyzer
    participant RM as RiskMetrics
    participant FS as FinancialStatementGenerator

    LG->>Sim: Generate losses (attritional + large + catastrophic)
    Sim->>EA: Trajectory data (insured & uninsured)
    EA->>EA: Calculate time-average growth
    EA->>EA: Calculate ensemble-average growth
    EA->>RM: Loss data for tail risk
    RM-->>EA: VaR, TVaR, drawdown metrics
    EA-->>BO: Ergodic metrics & analysis results

    BO->>BO: Define objectives & constraints
    BO->>SA: Request parameter sensitivity
    SA->>SA: Parameter sweep with caching
    SA-->>BO: SensitivityResult
    BO->>BO: Find optimal strategy via scipy.optimize
    BO-->>BO: OptimalStrategy

    BO->>FS: Generate financial statements
    FS->>FS: Build balance sheet
    FS->>FS: Build income statement
    FS->>FS: Build cash flow statement
    FS-->>BO: Formatted DataFrames
Key Design Patterns
1. Composite Pattern
ManufacturingLossGeneratorcomposesAttritionalLossGenerator,LargeLossGenerator, andCatastrophicLossGeneratorinto a unified interfaceEach sub-generator independently pairs a
FrequencyGeneratorwith aLossDistribution
2. Template Method (Abstract Base Class)
LossDistribution(ABC) defines the interface withgenerate_severity()andexpected_value()as abstract methodsLognormalLoss,ParetoLoss, andGeneralizedParetoLossimplement distribution-specific behavior
3. Dataclass Data Transfer Objects
ErgodicData,ErgodicAnalysisResults,OptimalStrategy,LossEvent,LossData,ConvergenceStats,RuinProbabilityResults,SensitivityResultall use@dataclassfor clean data transfer between modules
4. Factory Method
ManufacturingLossGenerator.create_simple()provides a simplified factory for migration from legacyClaimGeneratorLossData.from_loss_events()constructs data from a list ofLossEventobjects
5. Strategy Pattern
BusinessOptimizersupports multiple optimization strategies: ROE maximization, bankruptcy risk minimization, capital efficiency optimization, and multi-objective optimizationEach strategy uses different objective functions with
scipy.optimize
6. Caching
SensitivityAnalyzeruses MD5-based in-memory and persistent disk caching to avoid redundant optimization runs during parameter sweeps
Key structures:
Config: Pydantic-based configuration with validation
SimulationResults: Comprehensive result aggregation
ValidationMetrics: Performance and accuracy metrics
StateManagement: System state and progress tracking
Service Layer
The service layer diagram shows high-level services that orchestrate the core components, including analytics, optimization, and validation services.
Service Layer and Infrastructure
This document shows the service layer components that provide infrastructure support for the core simulation and analysis. Classes are grouped into logical sections reflecting their roles in the system.
Batch Processing Services
The batch processing subsystem coordinates parallel execution of multiple simulation scenarios with checkpointing and result aggregation.
        classDiagram
    class BatchProcessor {
        -loss_generator: ManufacturingLossGenerator
        -insurance_program: InsuranceProgram
        -manufacturer: WidgetManufacturer
        -n_workers: Optional~int~
        -checkpoint_dir: Path
        -use_parallel: bool
        -progress_bar: bool
        -batch_results: List~BatchResult~
        -completed_scenarios: Set~str~
        -failed_scenarios: Set~str~
        +process_batch(scenarios, resume_from_checkpoint, checkpoint_interval, max_failures) AggregatedResults
        +export_results(path, export_format)
        +export_financial_statements(path)
        +clear_checkpoints()
        -_process_serial(scenarios, checkpoint_interval, max_failures) List~BatchResult~
        -_process_parallel(scenarios, checkpoint_interval, max_failures) List~BatchResult~
        -_process_scenario(scenario) BatchResult
        -_aggregate_results() AggregatedResults
        -_save_checkpoint()
        -_load_checkpoint() bool
        -_perform_sensitivity_analysis() Optional~DataFrame~
    }

    class ParallelExecutor {
        -n_workers: int
        -cpu_profile: CPUProfile
        -chunking_strategy: ChunkingStrategy
        -shared_memory_config: SharedMemoryConfig
        -shared_memory_manager: SharedMemoryManager
        -monitor_performance: bool
        -performance_metrics: PerformanceMetrics
        +map_reduce(work_function, work_items, reduce_function, shared_data, progress_bar) Any
        +get_performance_report() str
        -_setup_shared_data(shared_data) Dict
        -_calculate_chunk_size(n_items, work_function) int
        -_profile_work_complexity(work_function) float
        -_create_chunks(work_items, chunk_size) List
        -_execute_parallel(work_function, chunks, shared_refs, progress_bar) List
        -_update_memory_metrics()
    }

    class SmartCache {
        -cache: Dict~Tuple, Any~
        -max_size: int
        -hits: int
        -misses: int
        -access_counts: Dict~Tuple, int~
        +get(key: Tuple) Optional~Any~
        +set(key: Tuple, value: Any)
        +clear()
        +hit_rate() float
    }

    class ScenarioManager {
        -scenarios: Dict~str, ScenarioConfig~
        -parameter_specs: List~ParameterSpec~
        +add_scenario(name, scenario)
        +get_scenario(name) ScenarioConfig
        +generate_scenarios(method, specs) List~ScenarioConfig~
        +generate_sensitivity_scenarios(specs) List~ScenarioConfig~
        +export_scenarios(path)
    }

    BatchProcessor --> ParallelExecutor : distributes work via
    BatchProcessor --> ScenarioManager : gets scenarios from
    BatchProcessor ..> SmartCache : caches results in
Monitoring Services
Monitoring services track simulation progress, convergence behavior, and provide real-time feedback during long-running computations.
        classDiagram
    class ProgressMonitor {
        -total_iterations: int
        -check_intervals: List~int~
        -update_frequency: int
        -show_console: bool
        -convergence_threshold: float
        -start_time: float
        -current_iteration: int
        -convergence_checks: List~Tuple~
        -converged: bool
        -converged_at: Optional~int~
        -monitor_overhead: float
        +update(iteration, convergence_value) bool
        +get_stats() ProgressStats
        +generate_convergence_summary() Dict
        +finish() ProgressStats
        +finalize()
        +get_overhead_percentage() float
        +reset()
    }

    class ConvergenceDiagnostics {
        -r_hat_threshold: float
        -min_ess: int
        -relative_mcse_threshold: float
        +calculate_r_hat(chains) float
        +calculate_ess(chain, max_lag) float
        +calculate_batch_ess(chains, method) float
        +calculate_ess_per_second(chain, computation_time) float
        +calculate_mcse(chain, ess) float
        +check_convergence(chains, metric_names) Dict~str, ConvergenceStats~
        +geweke_test(chain, first_fraction, last_fraction) Tuple
        +heidelberger_welch_test(chain, alpha) Dict
    }

    class AdvancedConvergenceDiagnostics {
        -fft_size: Optional~int~
        +calculate_autocorrelation_full(chain, max_lag, method) AutocorrelationAnalysis
        +calculate_spectral_density(chain, method, nperseg) SpectralDiagnostics
        +calculate_ess_batch_means(chain, batch_size, n_batches) float
        +calculate_ess_overlapping_batch(chain, batch_size) float
        +heidelberger_welch_advanced(chain, alpha, eps) Dict
        +raftery_lewis_diagnostic(chain, q, r, s) Dict
    }

    ConvergenceDiagnostics <|-- AdvancedConvergenceDiagnostics : extends
    ProgressMonitor ..> ConvergenceDiagnostics : uses convergence values from
Storage Services
Storage services handle memory-efficient persistence of simulation trajectories and time-series data using memory-mapped arrays or HDF5.
        classDiagram
    class TrajectoryStorage {
        -config: StorageConfig
        -storage_path: Path
        -_summaries: Dict~int, SimulationSummary~
        -_memmap_files: Dict~str, memmap~
        -_hdf5_file: Optional~File~
        -_total_simulations: int
        -_disk_usage: float
        +store_simulation(sim_id, annual_losses, insurance_recoveries, retained_losses, final_assets, initial_assets, ruin_occurred, ruin_year)
        +load_simulation(sim_id, load_time_series) Dict
        +export_summaries_csv(output_path)
        +export_summaries_json(output_path)
        +get_storage_stats() Dict
        +clear_storage()
        -_setup_memmap()
        -_setup_hdf5()
        -_store_summary(summary)
        -_store_time_series(sim_id, annual_losses, insurance_recoveries, retained_losses)
        -_persist_summaries()
        -_check_disk_space() bool
        -_cleanup_memory()
    }

    class StorageConfig {
        +storage_dir: str
        +backend: str
        +sample_interval: int
        +max_disk_usage_gb: float
        +compression: bool
        +compression_level: int
        +chunk_size: int
        +enable_summary_stats: bool
        +enable_time_series: bool
        +dtype: Any
    }

    TrajectoryStorage --> StorageConfig : configured by
Parameter Sweep Services
Parameter sweep services enable systematic exploration of the parameter space through grid search, adaptive refinement, and scenario comparison.
        classDiagram
    class ParameterSweeper {
        -optimizer: Optional~BusinessOptimizer~
        -cache_dir: Path
        -results_cache: Dict
        -use_parallel: bool
        +sweep(config, progress_callback) DataFrame
        +create_scenarios() Dict~str, SweepConfig~
        +find_optimal_regions(results, objective, constraints, top_percentile) Tuple
        +compare_scenarios(results, metrics, normalize) DataFrame
        +load_results(sweep_hash) Optional~DataFrame~
        +export_results(results, output_file, file_format)
        -_run_single(params, metrics) Dict
        -_apply_adaptive_refinement(initial_results, config) DataFrame
        -_save_results(df, config)
    }

    class SweepConfig {
        +parameters: Dict~str, List~
        +fixed_params: Dict~str, Any~
        +metrics_to_track: List~str~
        +n_workers: Optional~int~
        +batch_size: int
        +adaptive_refinement: bool
        +refinement_threshold: float
        +save_intermediate: bool
        +cache_dir: str
        +generate_grid() List~Dict~
        +estimate_runtime(seconds_per_run) str
    }

    ParameterSweeper --> SweepConfig : configured by
    ParameterSweeper --> ParallelExecutor : parallelizes with
Performance and Optimization Services
Performance services provide profiling, benchmarking, and optimization capabilities to ensure simulations run within target times and memory budgets.
        classDiagram
    class PerformanceOptimizer {
        -config: OptimizationConfig
        -cache: SmartCache
        -vectorized: VectorizedOperations
        +profile_execution(func) ProfileResult
        +optimize_loss_generation(losses, batch_size) ndarray
        +optimize_insurance_calculation(losses, layers) Dict
        +optimize_memory_usage() Dict
        +get_optimization_summary() str
        -_generate_recommendations(function_times, memory_usage, total_time) List
        -_calculate_optimal_chunk_size(available_memory) int
    }

    class BenchmarkSuite {
        -runner: BenchmarkRunner
        -results: List~BenchmarkResult~
        -system_info: Dict
        +benchmark_scale(engine, scale, config, optimizations) BenchmarkResult
        +run_comprehensive_benchmark(engine, config) ComprehensiveBenchmarkResult
        +compare_configurations(engine_factory, configurations, scale) ConfigurationComparison
    }

    class BenchmarkRunner {
        -profiler: SystemProfiler
        +run_single_benchmark(func, args, kwargs) BenchmarkMetrics
        +run_with_warmup(func, args, kwargs, warmup_runs, benchmark_runs) List~BenchmarkMetrics~
    }

    class VectorizedOperations {
        <<static>>
        +calculate_growth_rates(final_assets, initial_assets, n_years) ndarray
        +apply_insurance_vectorized(losses, attachment, limit) Tuple
        +calculate_premiums_vectorized(limits, rates) ndarray
    }

    PerformanceOptimizer --> SmartCache : caches with
    PerformanceOptimizer --> VectorizedOperations : optimizes with
    BenchmarkSuite --> BenchmarkRunner : runs benchmarks via
    PerformanceOptimizer ..> BenchmarkSuite : benchmarked by
Validation Services
Validation services ensure numerical accuracy and strategy performance through reference implementations, statistical tests, and backtesting.
        classDiagram
    class AccuracyValidator {
        -tolerance: float
        -reference: ReferenceImplementations
        -statistical: StatisticalValidation
        -edge_tester: EdgeCaseTester
        +compare_implementations(optimized_results, reference_results, test_name) ValidationResult
        +validate_growth_rates(optimized_func, test_cases) ValidationResult
        +validate_insurance_calculations(optimized_func, test_cases) ValidationResult
        +validate_risk_metrics(optimized_var, optimized_tvar, test_data) ValidationResult
        +run_full_validation() ValidationResult
        +generate_validation_report(results) str
    }

    class ReferenceImplementations {
        <<static>>
        +calculate_growth_rate_precise(final_assets, initial_assets, n_years) float
        +apply_insurance_precise(loss, attachment, limit) Tuple
        +calculate_var_precise(losses, confidence) float
        +calculate_tvar_precise(losses, confidence) float
        +calculate_ruin_probability_precise(paths, threshold) float
    }

    class StrategyBacktester {
        -simulation_engine: Optional~Simulation~
        -metric_calculator: MetricCalculator
        -results_cache: Dict~str, BacktestResult~
        +test_strategy(strategy, manufacturer, config, use_cache) BacktestResult
        +test_multiple_strategies(strategies, manufacturer, config) DataFrame
        -_calculate_metrics_mc(simulation_results, n_years) ValidationMetrics
        -_calculate_metrics(simulation_results, n_years) ValidationMetrics
    }

    class InsuranceStrategy {
        <<abstract>>
        +name: str
        +metadata: Dict
        +adaptation_history: List
        +get_insurance_program(manufacturer, historical_losses, current_year)* InsuranceProgram
        +update(losses, recoveries, year)
        +reset()
        +get_description() str
    }

    AccuracyValidator --> ReferenceImplementations : validates against
    StrategyBacktester --> InsuranceStrategy : backtests
    AccuracyValidator ..> StrategyBacktester : validates
Reporting Services
Reporting services aggregate simulation results and produce formatted Excel reports with financial statements, charts, and dashboards.
        classDiagram
    class ExcelReporter {
        -config: ExcelReportConfig
        -workbook: Optional~Any~
        -formats: Dict~str, Any~
        -engine: str
        +generate_trajectory_report(manufacturer, output_file, title) Path
        +generate_monte_carlo_report(results, output_file, title) Path
        -_select_engine()
        -_generate_with_xlsxwriter(generator, output_path, title)
        -_generate_with_openpyxl(generator, output_path, title)
        -_generate_with_pandas(generator, output_path)
        -_write_balance_sheets_xlsxwriter(generator)
        -_write_income_statements_xlsxwriter(generator)
        -_write_cash_flows_xlsxwriter(generator)
        -_write_reconciliation_xlsxwriter(generator)
        -_write_metrics_dashboard_xlsxwriter(generator)
        -_write_pivot_data_xlsxwriter(generator)
    }

    class ResultAggregator {
        -config: AggregationConfig
        -custom_functions: Dict~str, Callable~
        -_cache: Dict~str, Any~
        +aggregate(data: ndarray) Dict
        -_calculate_moments(data) Dict
        -_fit_distributions(data) Dict
    }

    class TimeSeriesAggregator {
        -window_size: int
        +aggregate(data: ndarray) Dict
        -_calculate_rolling_stats(data) Dict
        -_calculate_autocorrelation(data, max_lag) Dict
    }

    class PercentileTracker {
        -percentiles: List~float~
        -max_samples: int
        -total_count: int
        -_digest: TDigest
        +update(values: ndarray)
        +get_percentiles() Dict~str, float~
        +merge(other: PercentileTracker)
        +reset()
    }

    class HierarchicalAggregator {
        -levels: List~str~
        -config: AggregationConfig
        -aggregator: ResultAggregator
        +aggregate_hierarchy(data, level) Dict
        -_summarize_level(items) Dict
    }

    ResultAggregator --> ExcelReporter : feeds data to
    HierarchicalAggregator --> ResultAggregator : delegates to
    ResultAggregator ..> PercentileTracker : tracks percentiles with
    TimeSeriesAggregator --|> ResultAggregator : extends BaseAggregator
Visualization Services
Visualization services create and style charts and figures with multiple themes and export formats for reports, blogs, and presentations.
        classDiagram
    class FigureFactory {
        -style_manager: StyleManager
        -auto_apply: bool
        +create_figure(size_type, orientation, dpi_type, title) Tuple~Figure, Axes~
        +create_subplots(rows, cols, size_type, dpi_type, title) Tuple~Figure, ndarray~
        +create_line_plot(x_data, y_data, title, x_label, y_label) Tuple~Figure, Axes~
        +create_bar_plot(categories, values, title) Tuple~Figure, Axes~
        +create_scatter_plot(x_data, y_data, title) Tuple~Figure, Axes~
        +create_histogram(data, title, bins) Tuple~Figure, Axes~
        +create_heatmap(data, title) Tuple~Figure, Axes~
        +create_box_plot(data, title) Tuple~Figure, Axes~
        +format_axis_currency(ax, axis)
        +format_axis_percentage(ax, axis)
        +add_annotations(ax, annotations)
        +save_figure(fig, filepath, dpi_type)
    }

    class StyleManager {
        -theme: Theme
        -colors: ColorPalette
        -fonts: FontConfig
        -figure_config: FigureConfig
        -grid_config: GridConfig
        +set_theme(theme: Theme)
        +get_theme_config(theme) Dict
        +get_colors() ColorPalette
        +get_fonts() FontConfig
        +get_figure_config() FigureConfig
        +get_figure_size(size_type, orientation) Tuple
        +get_dpi(output_type) int
        +apply_style()
        +load_config(config_path)
        +save_config(config_path)
        +create_style_sheet() Dict
        +update_colors(updates)
        +update_fonts(updates)
    }

    class Theme {
        <<enumeration>>
        DEFAULT
        COLORBLIND
        PRESENTATION
        MINIMAL
        PRINT
    }

    FigureFactory --> StyleManager : styled by
    StyleManager --> Theme : uses
Service Interaction Flow
This sequence diagram shows the typical flow when a batch processing job is submitted and executed.
        sequenceDiagram
    participant Client
    participant BP as BatchProcessor
    participant SM as ScenarioManager
    participant PE as ParallelExecutor
    participant SC as SmartCache
    participant TS as TrajectoryStorage
    participant PM as ProgressMonitor
    participant RA as ResultAggregator
    participant ER as ExcelReporter

    Client->>BP: process_batch(scenarios)
    BP->>BP: _load_checkpoint()
    BP->>SM: Filter pending scenarios

    alt Use parallel processing
        BP->>PE: _process_parallel(scenarios)
        loop For each scenario chunk
            PE->>PE: map_reduce(work_function)
            PE->>PM: Update progress
            PM-->>Client: Console progress bar
        end
        PE-->>BP: List of BatchResults
    else Serial processing
        BP->>BP: _process_serial(scenarios)
        loop For each scenario
            BP->>BP: _process_scenario(scenario)
            BP->>BP: _save_checkpoint() periodically
        end
    end

    BP->>TS: store_simulation() for each result
    BP->>BP: _aggregate_results()
    BP->>RA: aggregate(result_data)
    RA-->>BP: AggregatedResults

    alt Export requested
        BP->>ER: generate_trajectory_report()
        ER-->>Client: Excel report path
    end

    BP-->>Client: AggregatedResults
Service Layer Patterns
1. Unit of Work Pattern
BatchProcessor coordinates complex multi-scenario operations
Checkpointing ensures consistency and recoverability across service calls
2. Repository Pattern
TrajectoryStorage abstracts data persistence with memmap/HDF5 backends
ScenarioManager provides a repository for scenario configurations
3. Strategy Pattern
InsuranceStrategy defines an abstract interface for different insurance approaches
StrategyBacktester tests interchangeable strategies through a common interface
4. Pipeline Pattern
Data flows from BatchProcessor through aggregation to reporting
Each service transforms data for the next stage in the pipeline
5. Decorator Pattern
ProgressMonitor decorates long-running operations with progress tracking
SmartCache decorates expensive computations with LRU caching
6. Factory Pattern
FigureFactory creates standardized visualizations with consistent styling
SweepConfig.generate_grid() produces parameter combinations
7. Adapter Pattern
ExcelReporter adapts results to Excel format via xlsxwriter, openpyxl, or pandas
TrajectoryStorage adapts to different backends (memmap, HDF5)
Service categories:
Analytics Services: ErgodicAnalyzer, RiskMetrics, ConvergenceDiagnostics
Optimization Services: BusinessOptimizer, HJBSolver, ParetoFrontier
Simulation Services: MonteCarloEngine, ParallelExecutor, BatchProcessor
Validation Services: WalkForwardValidator, StrategyBacktester, BenchmarkSuite
Design Patterns
The architecture employs several well-established design patterns:
Pattern |
Implementation |
|---|---|
Factory Pattern |
ConfigManager creates appropriate configuration objects |
Strategy Pattern |
StochasticProcess implementations (GBM, OU, Lognormal) |
Observer Pattern |
ProgressMonitor with callbacks for real-time updates |
Template Method |
LossDistribution abstract base class |
Adapter Pattern |
ConfigLoader bridges legacy and current configuration interfaces |
Singleton Pattern |
ConfigManager ensures single configuration instance |
Command Pattern |
BatchProcessor queues and executes simulation tasks |
Composite Pattern |
InsuranceProgram composes multiple InsuranceLayers |
Repository Pattern |
TrajectoryStorage abstracts data persistence |
Chain of Responsibility |
ResultAggregator chains for hierarchical processing |
Performance Architecture
The system is designed for high-performance computation:
Operation |
Target |
Status |
|---|---|---|
1000-year simulation |
< 1 minute |
✅ Achieved |
100K Monte Carlo iterations |
< 10 minutes |
✅ Achieved |
1M iterations |
Overnight |
✅ Achieved |
Memory per trajectory |
< 1MB |
✅ Optimized |
Parallel efficiency |
> 80% |
✅ Verified |
Key Architectural Decisions
Modular Design: Each module has a single, well-defined responsibility
Configuration-Driven: All parameters externalized through Pydantic models
Parallel Processing: CPU-optimized execution for large-scale simulations
Ergodic Theory Integration: Core differentiation through time vs ensemble analysis
Extensible Plugin Architecture: New components without modifying core
85+% Test Coverage: Comprehensive testing across all modules